Chapter 6 Current reservoir management rules: modeling and climate change impact
The modeling of the current management rules of the reservoir allows to get simulated flows influenced by these rules in a simulation forced by climate projections, and it provides a base line for comparison with new management rules which, will processed in the report “IN-WOP project WP3 - Seine River study case: Risk-based management rules and assessment of fairness under climate change”.
The so-called “Current reservoir management rules” are used by the EPTB Seine-Grands-Lacs for operating the AUBE, SEINE, MARNE and YONNE lakes. These management rules are described in Dehay (2012) and has already been modeled during for the ClimAware project [Dorchies et al. (2014);dorchiesClimateChangeImpacts2016].
This section therefore focuses on integrating these rules into the model seinebasin2 and assess the evolution of hydrological indicators in the light of climate projections.
6.1 Modeling of reservoir intake and release flows
As the current reservoir management rules are essentially local and not centralized, it’s possible to compute reservoir intake and release flows off line, from the simulated uninfluenced flows.
All these constraints are compliant with the conceptualization of reservoir connections described in Figure 3.1.
The management constraints are modeled in this order (constraints are overwritten if several apply):
- define intake or release flow in order to follow the objective curve
- release water to support low-flow to meet the reserved flow
- limit the intake in order to respect the reserved flow
- fill the reservoir in order to maintain the flow under the so called “reference” flow
- limit the release in order to not exceed the reference flow
- limit the intake and the release to the capacity of their respective canals (Table 6.1)
- add the replenishment of natural rivers if so
- limit daily variation of the release at Lake Yonne (\(\Delta Q_{max}\) = 2 m3/s)
- limit intake and release in order to stay in the range of minimum and maximum capacities of the reservoir (Table 6.2)
| Reservoir ID | Connection ID | Max flow rate (m3/s) |
|---|---|---|
| LAC_AUBE | P_AUBE | 135 |
| LAC_AUBE | R_AUBE | 35 |
| LAC_MARNE | P_MARNE | 375 |
| LAC_MARNE | P_BLAISE | 33 |
| LAC_MARNE | R_MARNE | 50 |
| LAC_SEINE | P_SEINE | 200 |
| LAC_SEINE | R_SEINE | 35 |
| LAC_YONNE | CHAUM_07 | 0 |
| LAC_YONNE | H2021010 | 16 |
| Reservoir ID | Min. volume (mcm) | Max. volume (mcm) | Storage capacity (mcm) |
|---|---|---|---|
| LAC_AUBE | 2.3 | 183.5 | 181.2 |
| LAC_MARNE | 10.0 | 364.5 | 354.5 |
| LAC_SEINE | 6.6 | 219.5 | 212.9 |
| LAC_YONNE | 8.5 | 82.5 | 74.0 |
Intake and release flows are determined at each time step with the rules presented above from a state based on: - the simulated uninfluenced flows; - the lake volumes updated from the previous time step.
These data are then included in the modeling process in order to get simulated flows influenced by current reservoir management rules.
6.2 Simulation of flows with current rules on the historical period
The simulation has been performed on the historical period and we compare the simulated influenced flows with the observed ones in order to assess the quality of the “current rules” model.
The location where the influence is at its greatest is immediately downstream of the reservoirs.
Figure 6.1 presents the comparison of the hydrological regime on the
stations R_AUBE (AUBE), R_MARNE (MARNE), R_SEINE (SEINE) and H2021010 (YONNE).
On Aube, Seine and Marne lakes, the model correctly reproduced the observed flow. However, the low-flow period downstream the Aube Lake has a significant gap.
On the Yonne Lake (station H2021010), the gap is similar as the one already observed
on the calibration results where the observed reservoir releases were directly used in the model.
No explanation to this gap has been emerged so far.
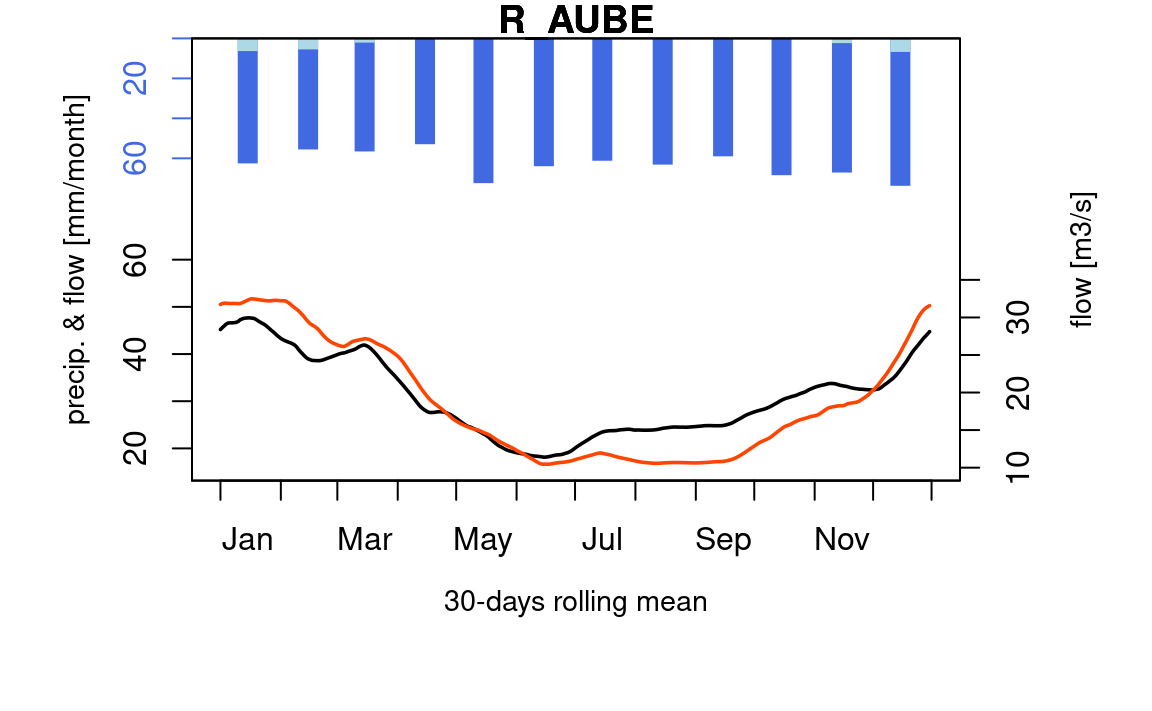
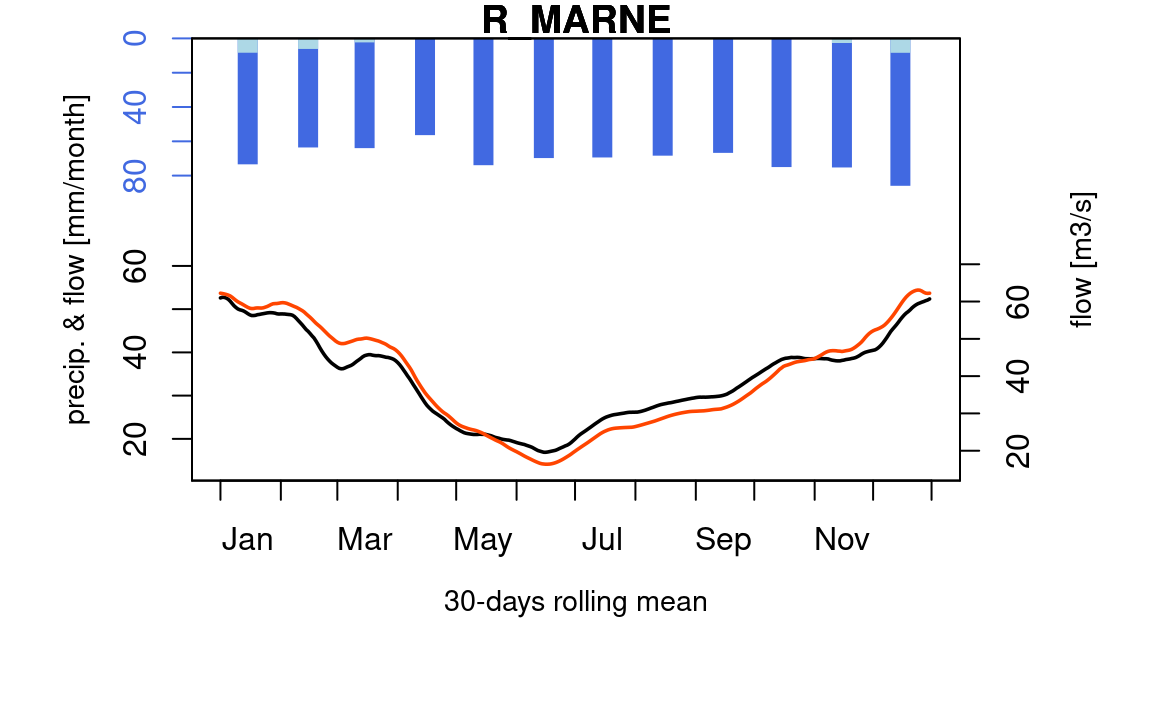
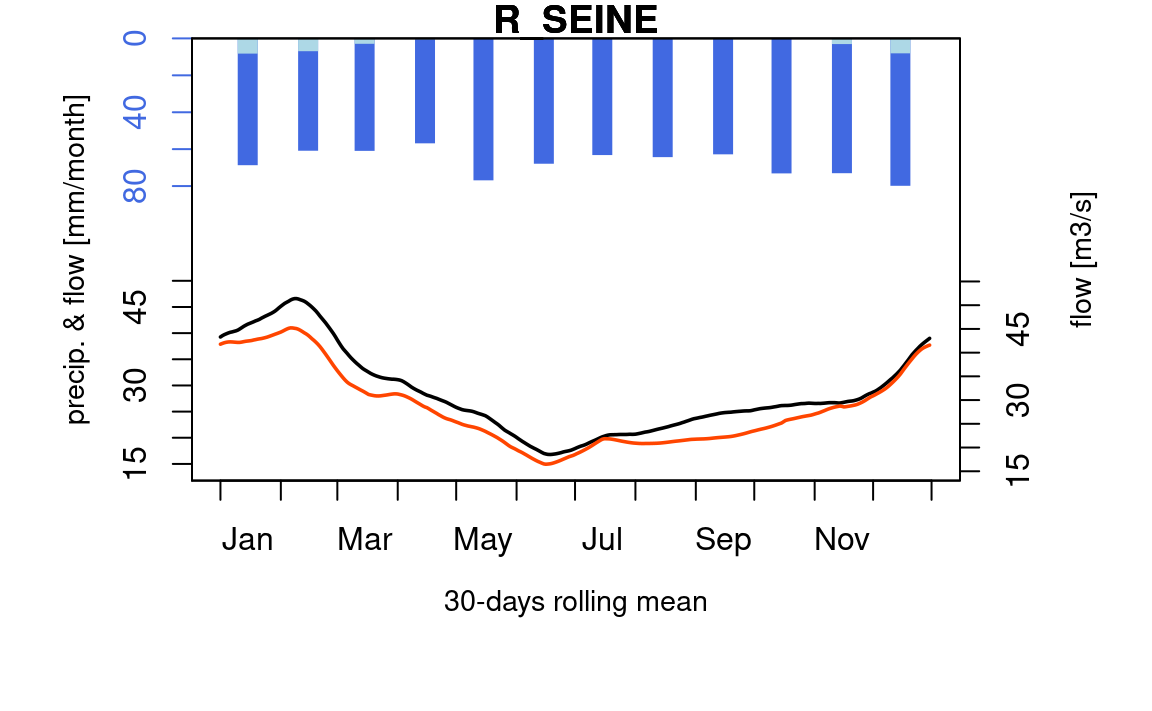
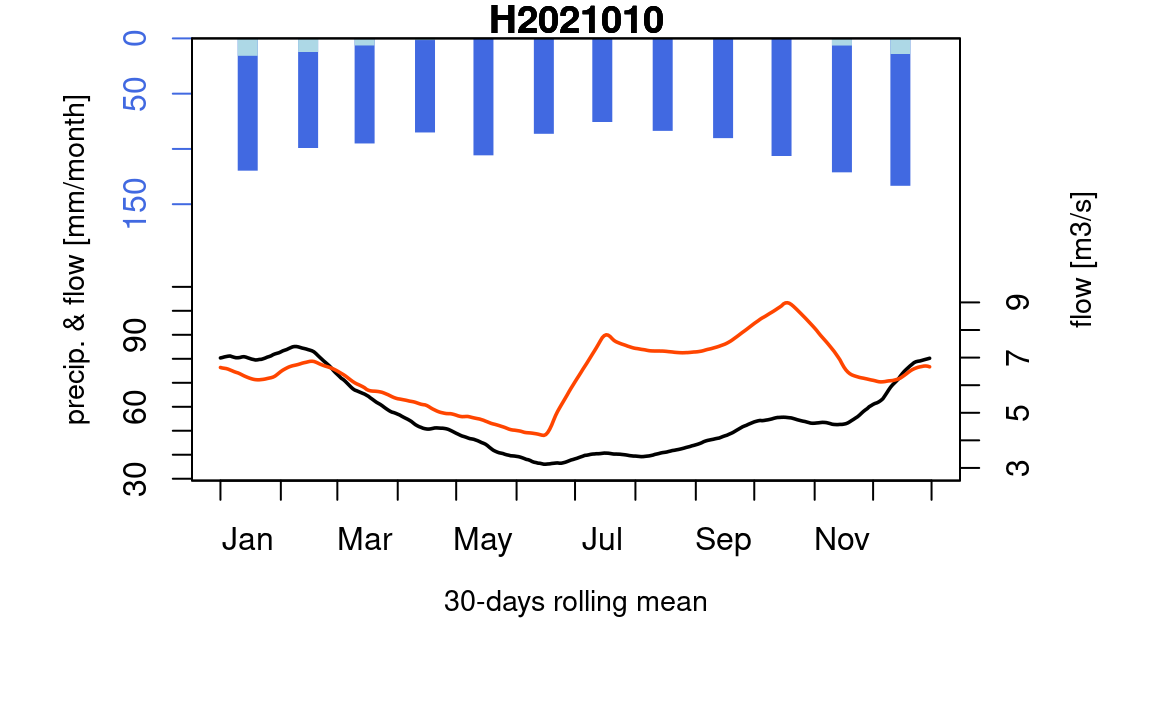
Figure 6.1: Hydrological regimes on gauging stations downstream the reservoirs Aube, Marne, Seine, and Yonne respectively with observed flows in black and flows simulated with modeled current rules in orange for the period 1959-2022
As one can see in Figure 6.2, the hydrological regime is perfectly reproduced at Paris.
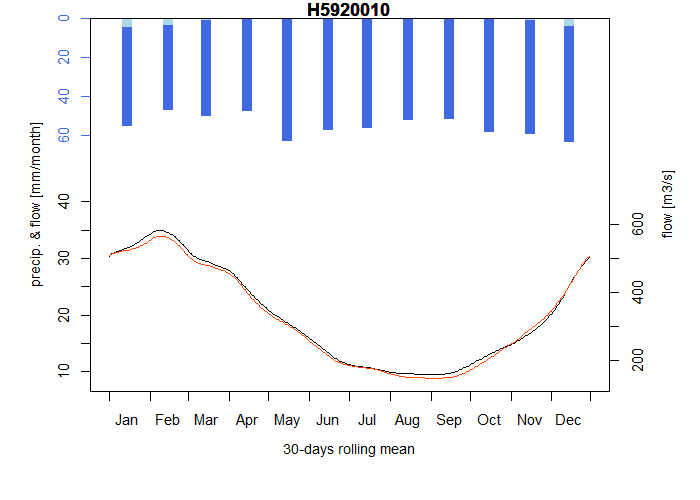
Figure 6.2: Simulated hydrological regime at Paris with the modeled current rules (1959-2020)
A global assessment is also performed with the same indicators used during the calibration process (Chazot et al. 2012).
The ratio between simulated and observed mean flows for all sub-basin is shown on Figure 6.3. We see an error inferior at 10% on all sub-basins downstream the reservoir.
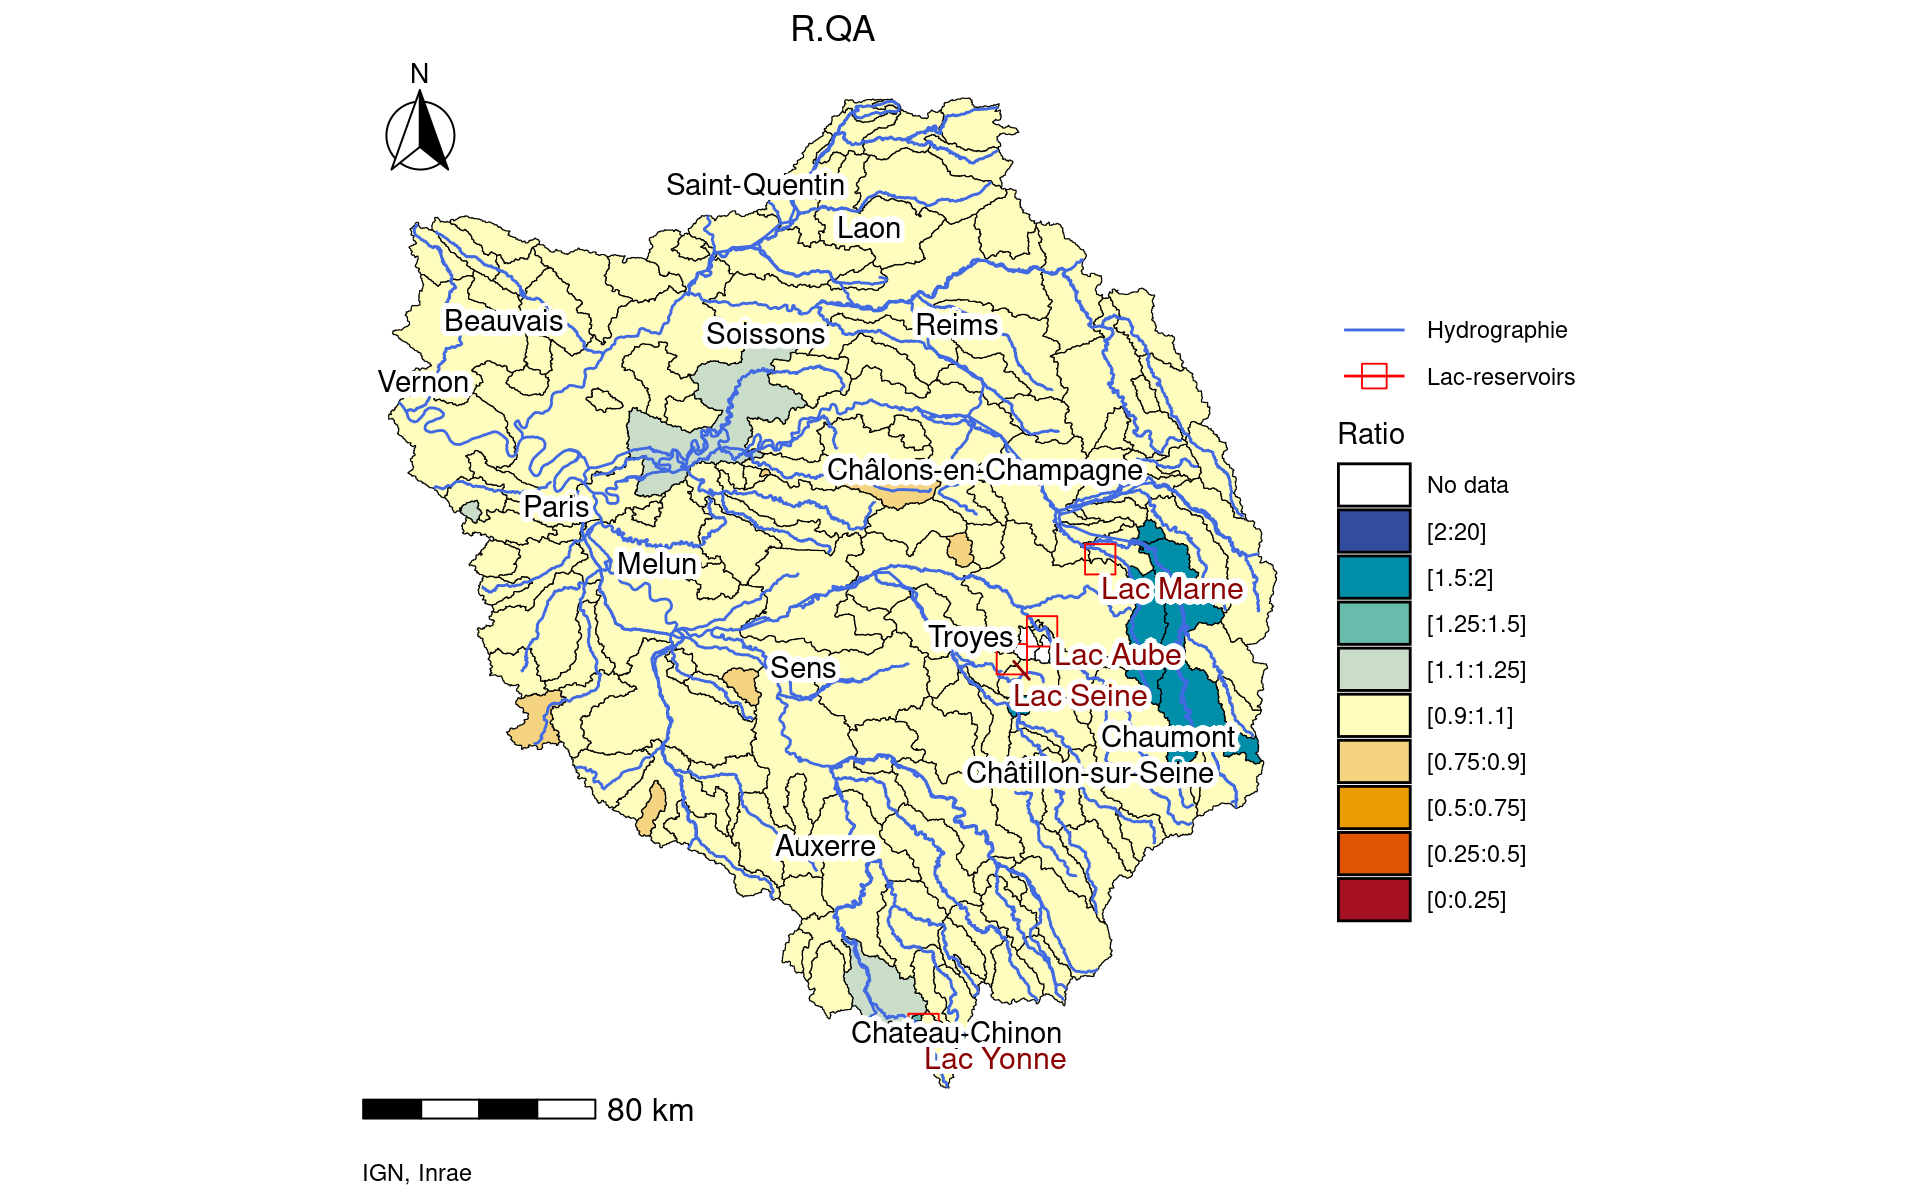
Figure 6.3: Map of R-QA indicators for simulated flows influenced by modeled reservoir current rules calculated on period 1959-2022
On the VCN30 of 2 years return period (Figure @ref{fig:05-plotVCN30Y2}), the model usually underestimates the flow by 25 to 50% and we see the same trend on the QMNA5 (Figure 6.5)
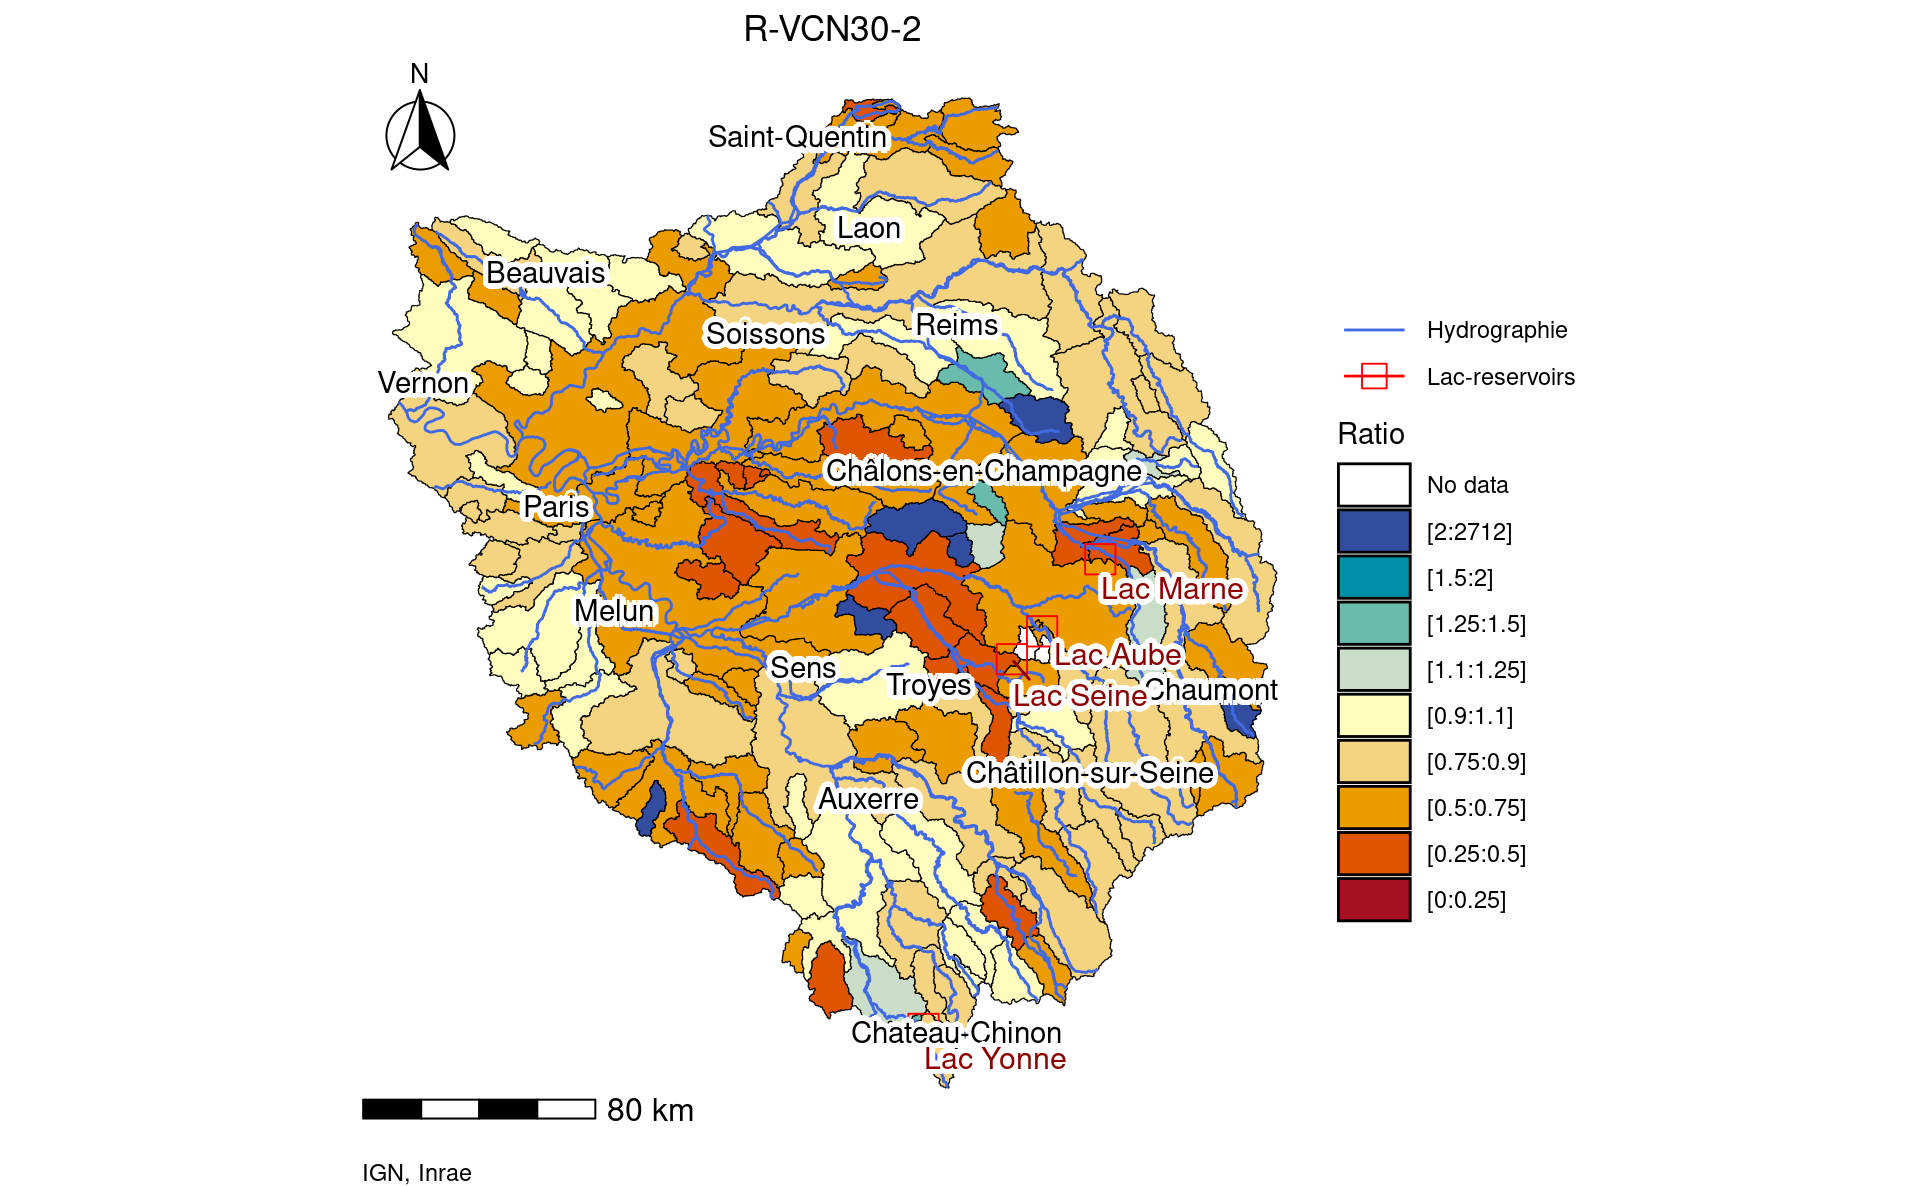
Figure 6.4: Map of R-VCN30-2 indicators for simulated flows influenced by modeled reservoir current rules calculated on period 1959-2022
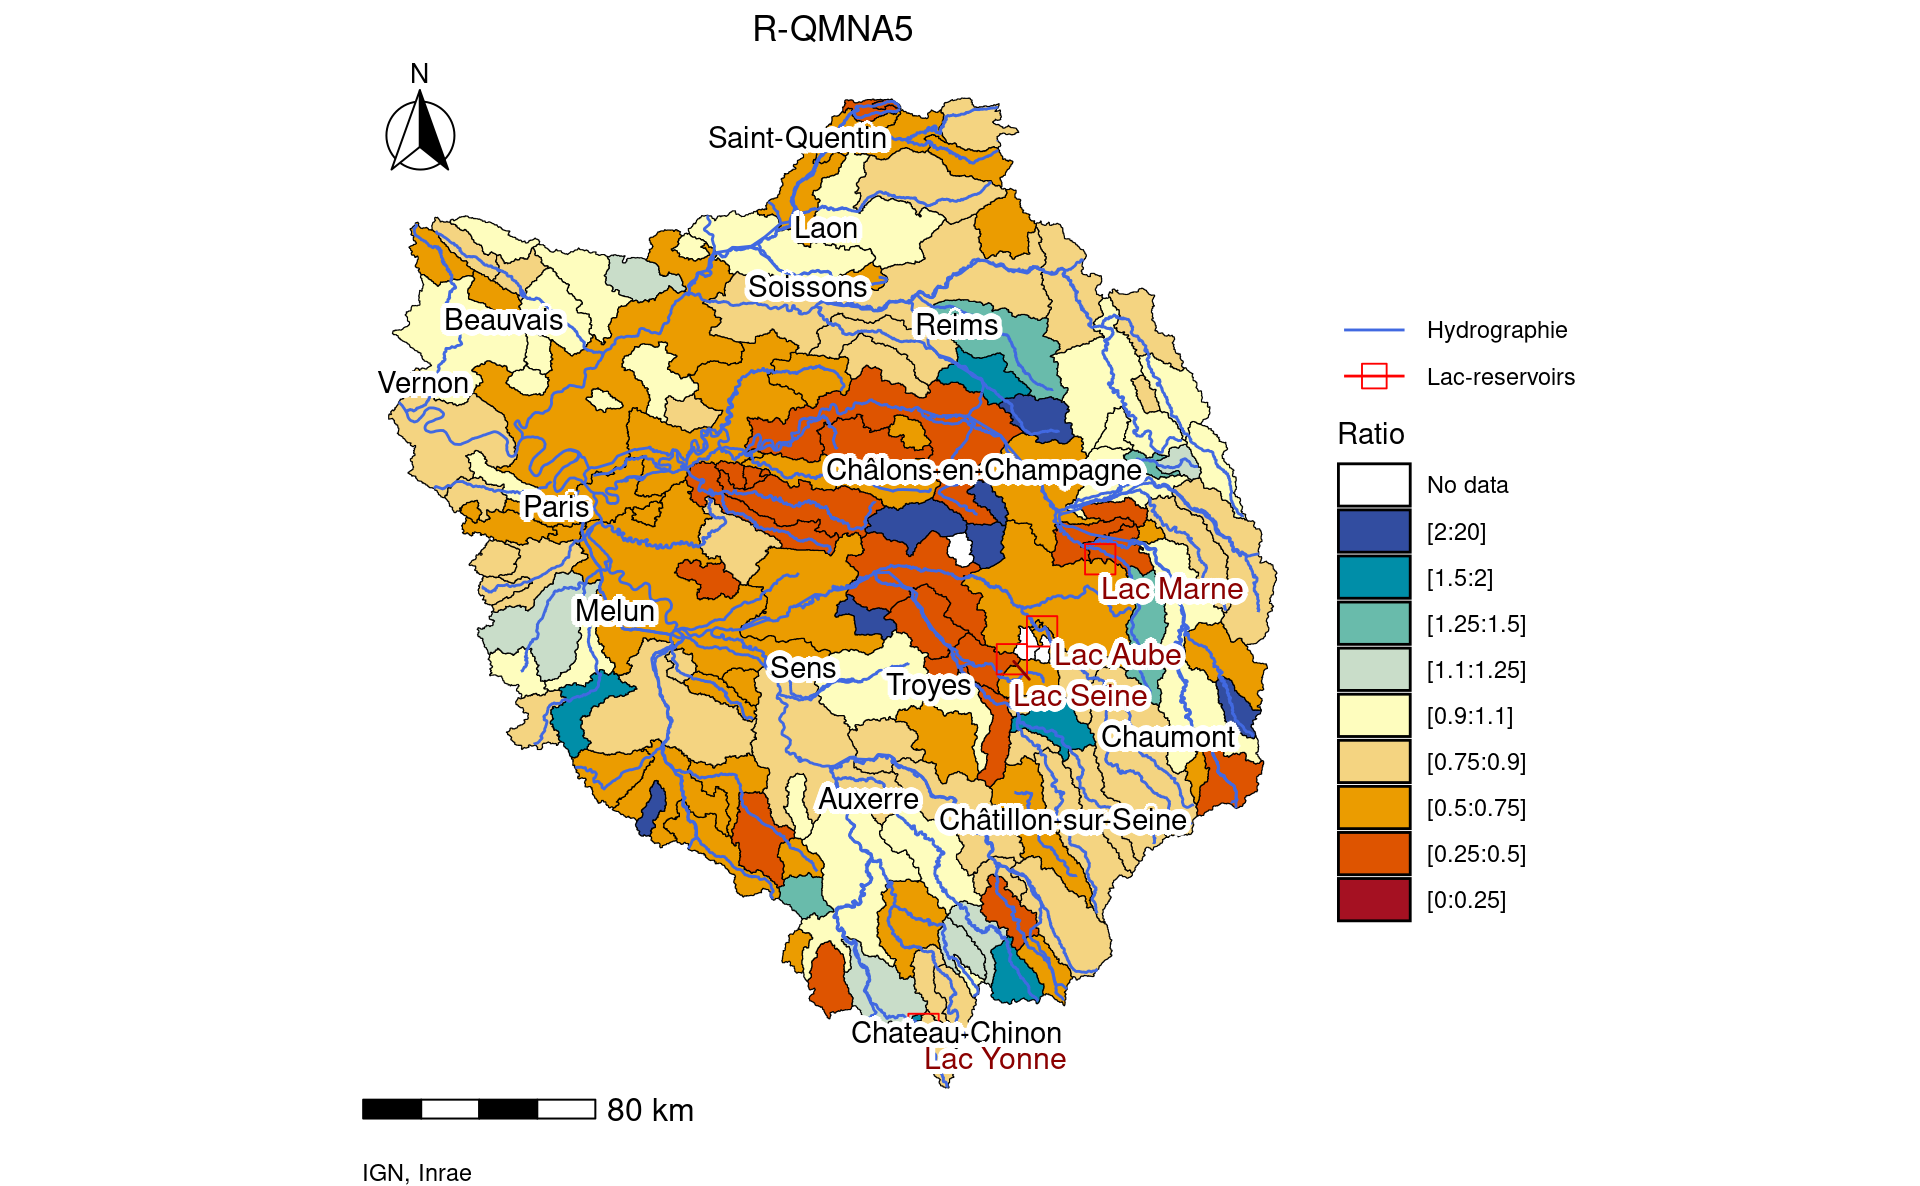
Figure 6.5: Map of R-QMNA5 indicators for simulated flows influenced by modeled reservoir current rules calculated on period 1959-2022
Flood indicators QJXA10 (Figure 6.6) show better results with a light overestimation fading away downstream Paris.
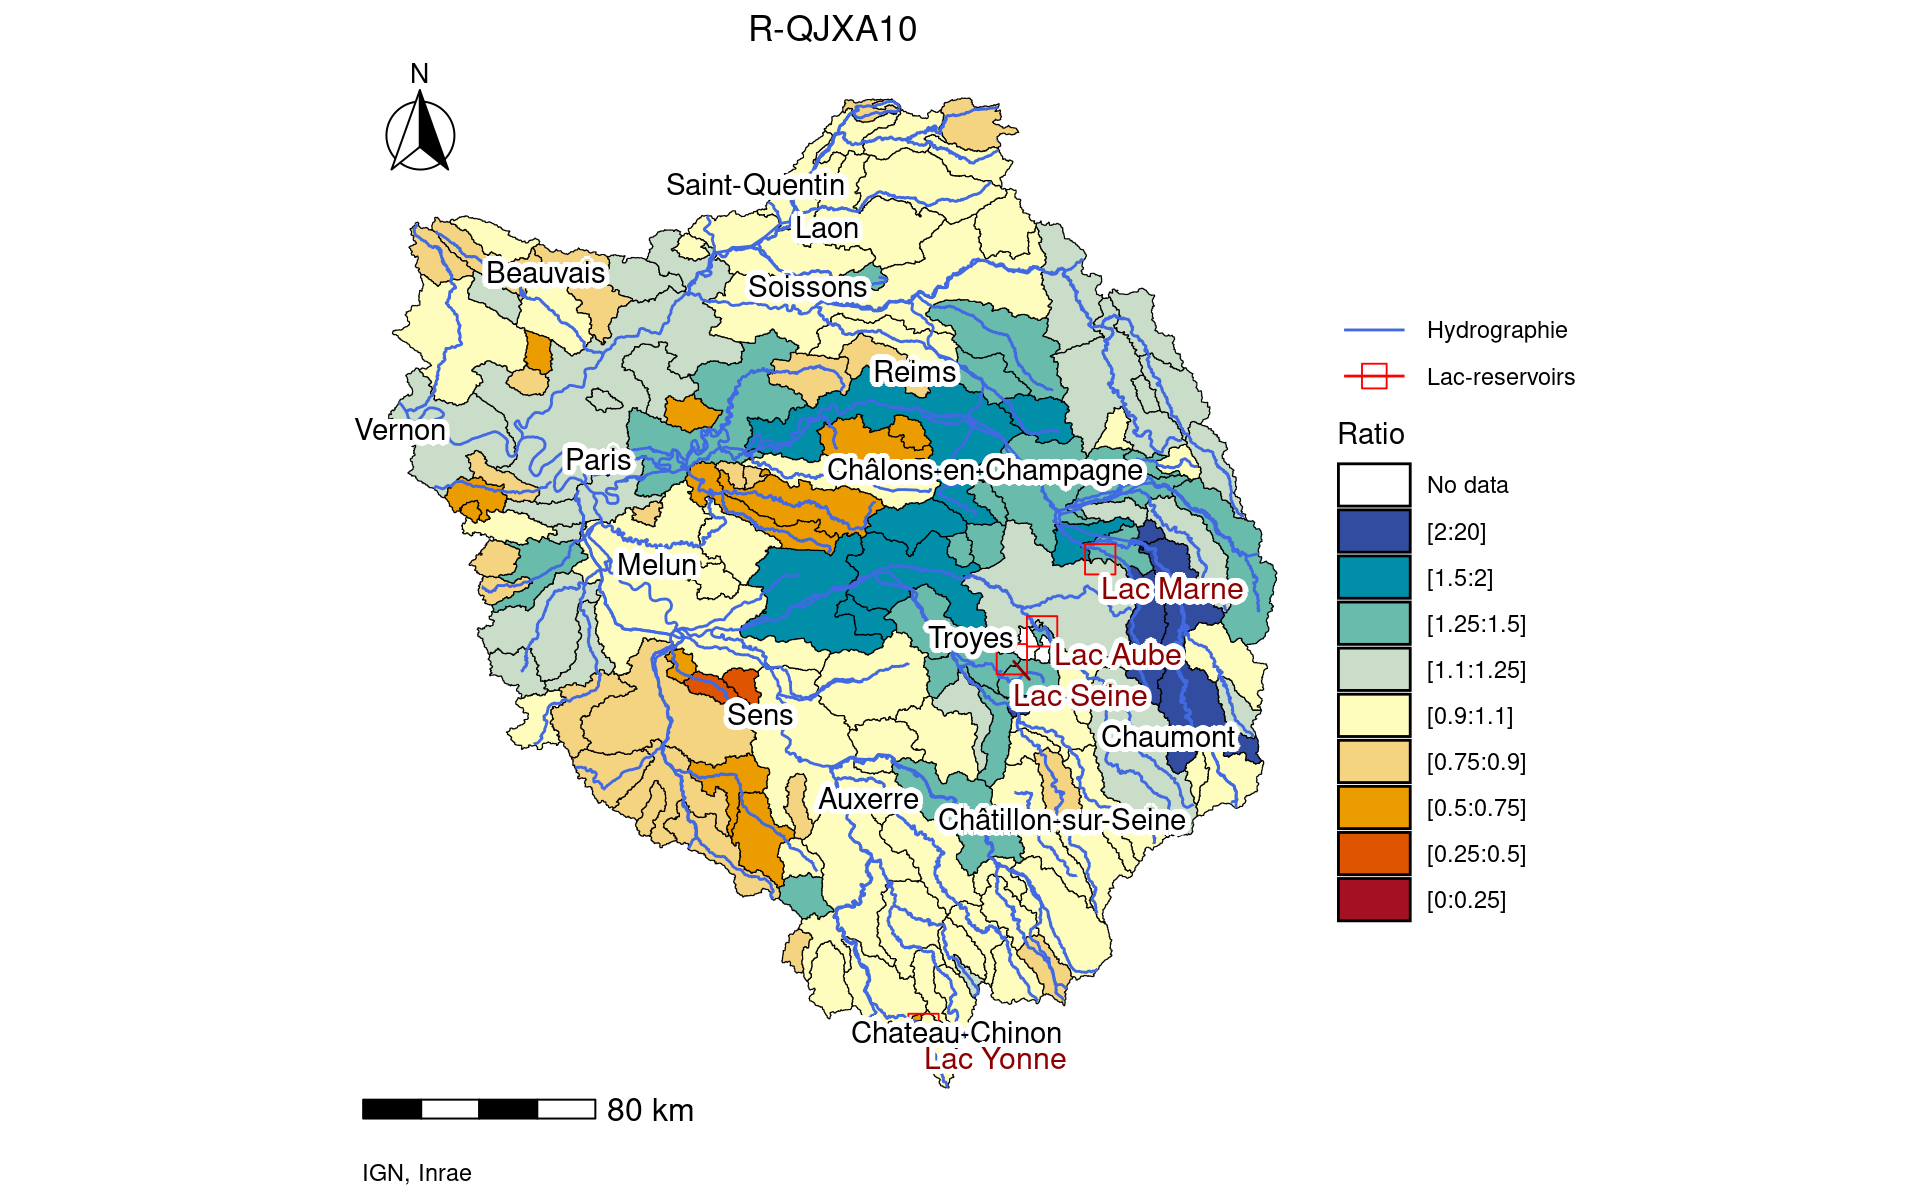
Figure 6.6: Map of R-QJXA10 indicators for simulated flows influenced by modeled reservoir current rules calculated on period 1959-2022
All the ratio indicators provided by Chazot et al. (2012) are compiled in one radar plot Figure 6.7 for the 9 monitoring stations used to assess the management performance.
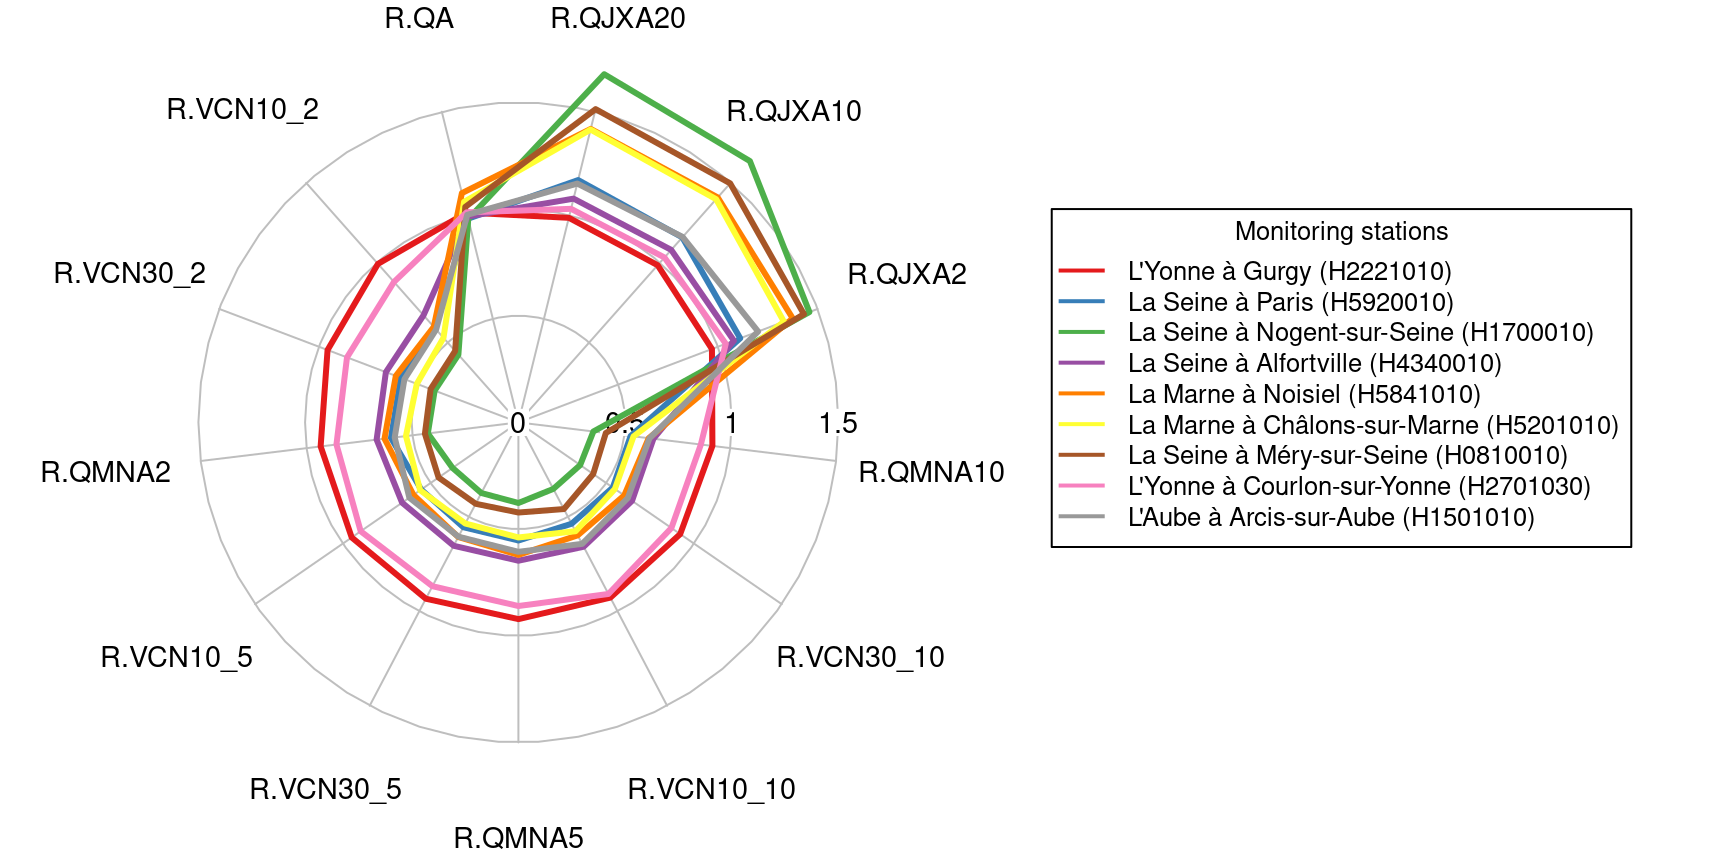
Figure 6.7: Ratio between hydrological indicators calculated on simulated flows with current management rules and observed influenced flows on the period 1959-2022
Simulated flows with modeled current rules forced by historical climate are available via this link: https://nextcloud.inrae.fr/s/adinzGa3AmLEXnZ?path=%2F04-current_rules%2Fv2.0%2Fhistorical%2Fdata
6.3 Current rules under climate change
6.3.1 Modeling current rules forced by climate projections
Calculations of intakes and releases at the reservoirs (See section 6.1) are performed from the outputs of the simulation of the uninfluenced flows forced by climate projections. The simulation of the current rules is then performed by injecting these influences in the model as it has been previously done for historical climate.
Simulated flows for all climate projections are available via this link: https://nextcloud.inrae.fr/s/adinzGa3AmLEXnZ?path=%2F04-current_rules%2Fv2.0%2FDRIAS2020_NEW
6.3.2 Impact of climate change on simulated current rules
We perform the same assessment as the one performed for climate change impact on simulated uninfluenced flows in Section 5.4.
6.3.2.1 Results on monthly flows simulated with modeled current rules
The Figures 6.8 and 6.9 show the monthly flow simulated with modeled current rules and forced by climate projections for the reference period (1976-2005) and the end of century period (2071-2100) respectively.
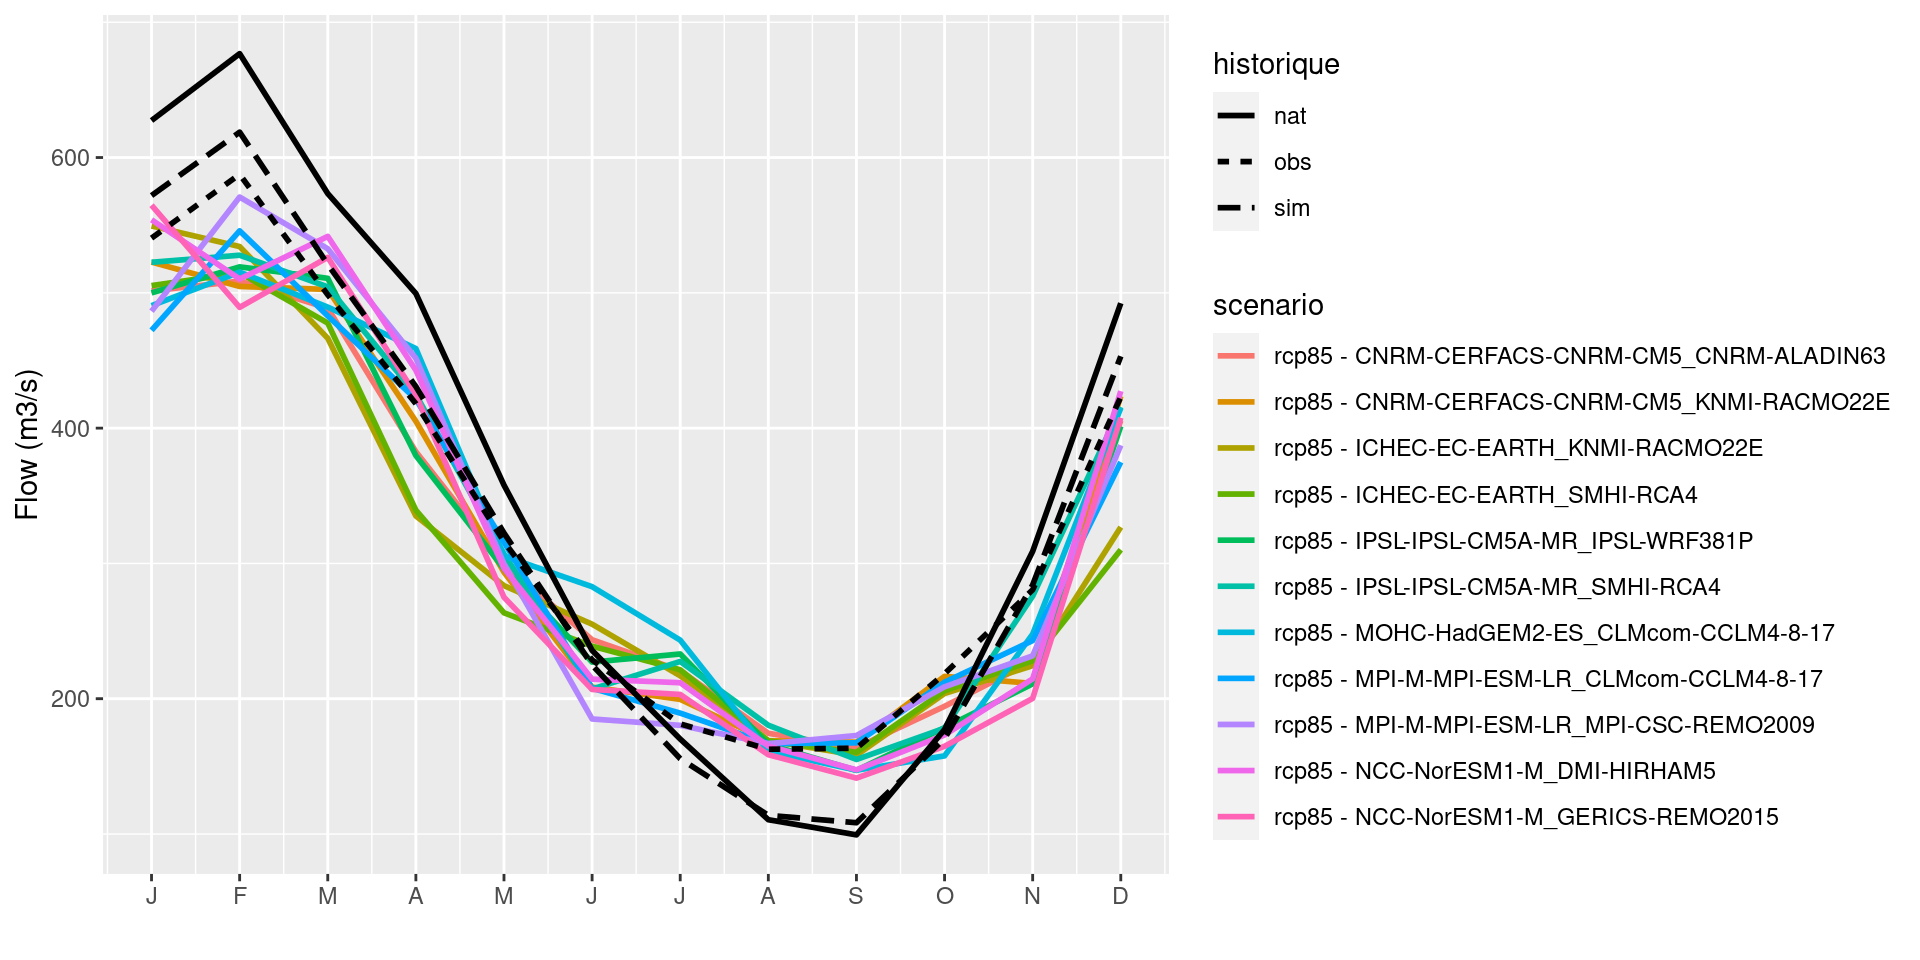
Figure 6.8: Monthly mean flows at Paris (H5920010) calculated on period 1976-2005: comparison between observed (obs), simulated with observed influences (sim), simulated without influences (nat), and simulated with modeled influences forced by climate projections
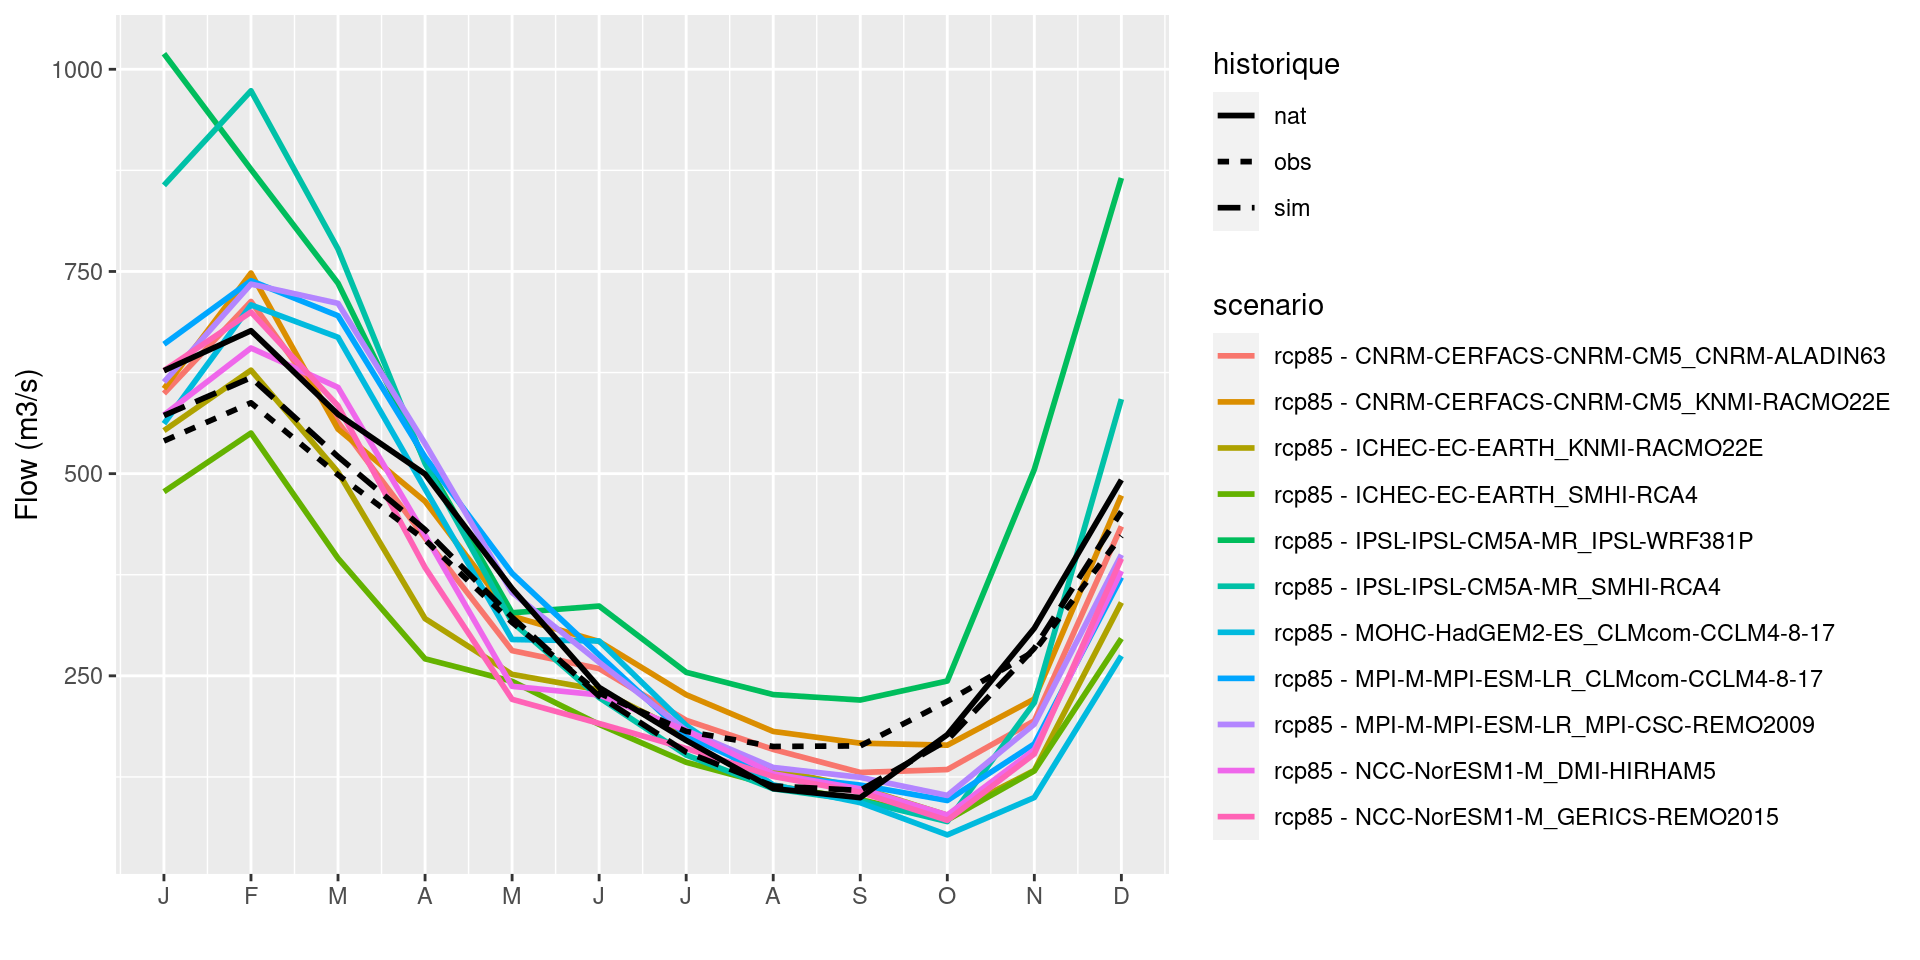
Figure 6.9: Monthly mean flows at Paris (H5920010): comparison between observed (obs), simulated with observed influences (sim), simulated without influences (nat) calculated on period 1976-2005, and simulated with modeled influences forced by RCP8.5 climate projections calculated on period 2071-2100
6.3.2.2 Evolution of hydrological indicators
The same evolution table as the one provided in section 5.4.3 has been produced.
These synthetic tables providing minimum, median, and maximum evolution among
the 11 climate projections for each stations for both monthly indicators such as in the
Table 5.1, and hydrological indicators such as in Table
5.2 for Paris-Austerlitz gauging station (H5920010)
between 1976-2005 and 2071-2100 in RCP 8.5.
| obs | sim | nat | min | med | max | |
|---|---|---|---|---|---|---|
| M1 | 540.4 | 571.9 | 627.4 | -5.5 | 15.7 | 103.9 |
| M2 | 587.6 | 618.8 | 676.8 | 6.9 | 37.5 | 84.4 |
| M3 | 498.6 | 521.0 | 573.3 | -17.2 | 15.3 | 54.2 |
| M4 | 418.1 | 430.7 | 499.5 | -20.1 | 9.9 | 35.8 |
| M5 | 316.1 | 322.5 | 357.9 | -20.0 | -3.4 | 19.3 |
| M6 | 228.7 | 224.9 | 235.7 | -20.5 | 6.3 | 48.1 |
| M7 | 181.4 | 155.7 | 170.2 | -35.3 | -14.0 | 13.6 |
| M8 | 162.6 | 113.8 | 110.6 | -38.8 | -20.8 | 36.5 |
| M9 | 163.4 | 108.3 | 99.4 | -39.5 | -27.9 | 49.7 |
| M10 | 218.5 | 170.5 | 177.3 | -66.2 | -55.0 | 36.4 |
| M11 | 280.5 | 284.1 | 308.9 | -59.8 | -23.4 | 139.5 |
| M12 | 423.1 | 453.1 | 492.3 | -33.8 | 3.2 | 115.7 |
| obs | sim | nat | min | med | max | |
|---|---|---|---|---|---|---|
| QA | 335.4 | 329.9 | 359.3 | -18.1 | 6.8 | 62.3 |
| VCN10_2 | 114.7 | 67.5 | 65.1 | -55.2 | -38.5 | 36.5 |
| VCN30_2 | 126.6 | 74.6 | 72.5 | -58.1 | -42.4 | 40.9 |
| QMNA2 | 133.9 | 80.6 | 78.9 | -57.8 | -41.4 | 38.1 |
| VCN10_5 | 91.3 | 50.6 | 46.8 | -56.9 | -40.1 | 31.3 |
| VCN30_5 | 99.5 | 55.2 | 51.5 | -55.7 | -44.4 | 33.5 |
| QMNA5 | 104.9 | 58.1 | 54.7 | -55.5 | -39.8 | 30.1 |
| VCN10_10 | 81.0 | 43.5 | 39.4 | -58.2 | -41.0 | 28.7 |
| VCN30_10 | 87.7 | 47.1 | 43.0 | -58.0 | -42.2 | 29.8 |
| QMNA10 | 92.4 | 49.0 | 45.2 | -57.4 | -36.1 | 26.1 |
| QJXA2 | 1076.2 | 1196.7 | 1373.0 | 4.0 | 23.7 | 74.2 |
| QJXA10 | 1527.7 | 1770.2 | 1928.8 | 12.8 | 26.9 | 77.1 |
| QJXA20 | 1700.3 | 1989.3 | 2141.2 | 11.2 | 29.5 | 81.2 |
In this configuration (RCP 8.5 and evolution between 1976-2005 and 2071-2100), the comparison of the median value of the evolution of the QA indicator between the Figure 5.7 for uninfluenced flows and the Figure 5.7 for influenced flows with the current management rules shows no differences. Indeed, as the management of the reservoir in annual, we can’t see any effect of them on the inter-annual mean flow.
The comparison of the median evolution of the QMNA5 low-flow indicator (Figure 6.11) shows that the impact is the same as for uninfluenced flows 5.8 at almost all gauging stations except on the Marne river and downstream where the impact is increased for influenced flows. The reservoir influence, at least with the current rules, seems therefore to increase the vulnerability to water shortages as noticed by Di Baldassarre et al. (2018).
The comparison between Figures 5.9 and 6.12 for the QJXA10 high-flow indicator shows no difference except a mitigation of the impact with the influenced flows on the sub-basin straight downstream the Aube lake.
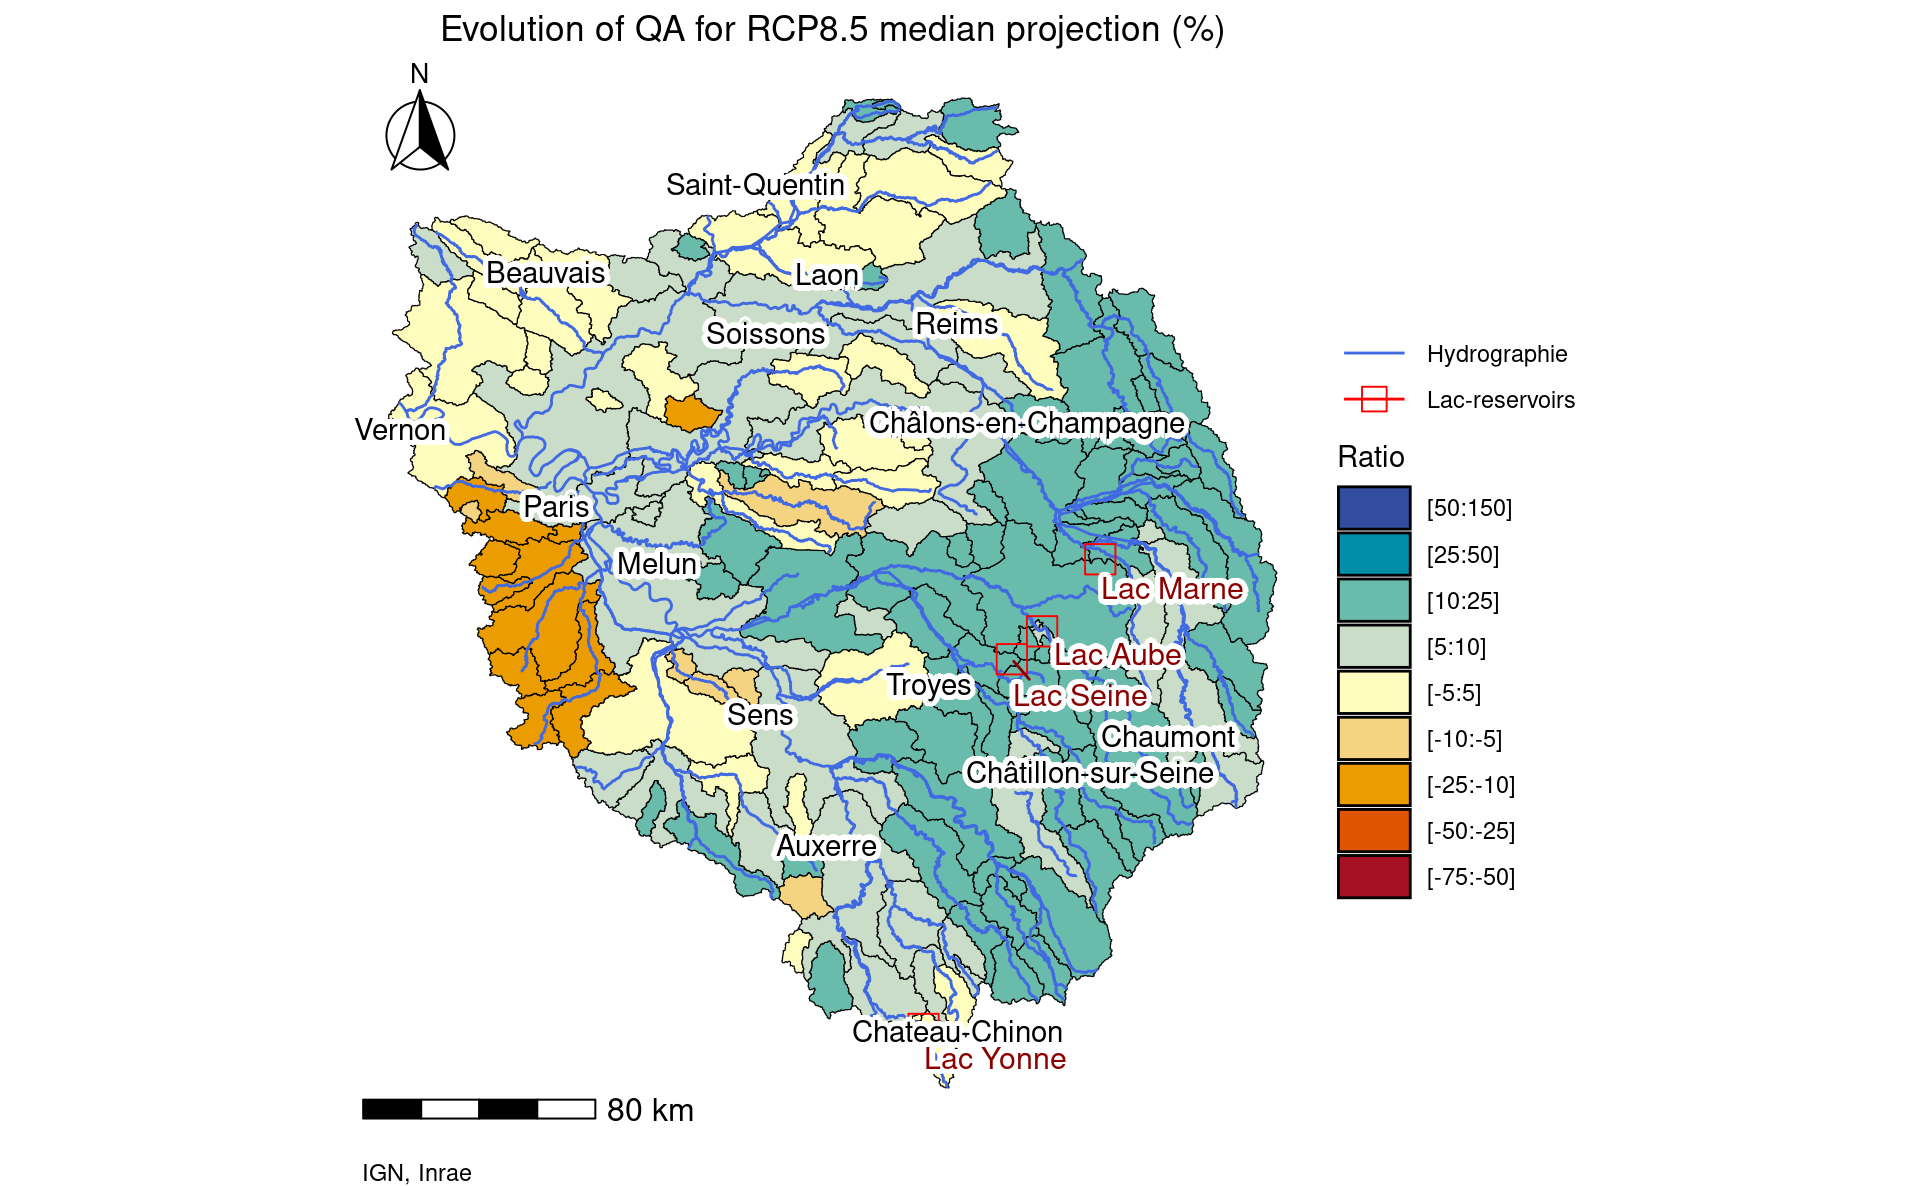
Figure 6.10: Map of median scenario evolution of indicator QA between 1976-2005 and 2071-2100 for RCP 8.5 with simulated influenced flows
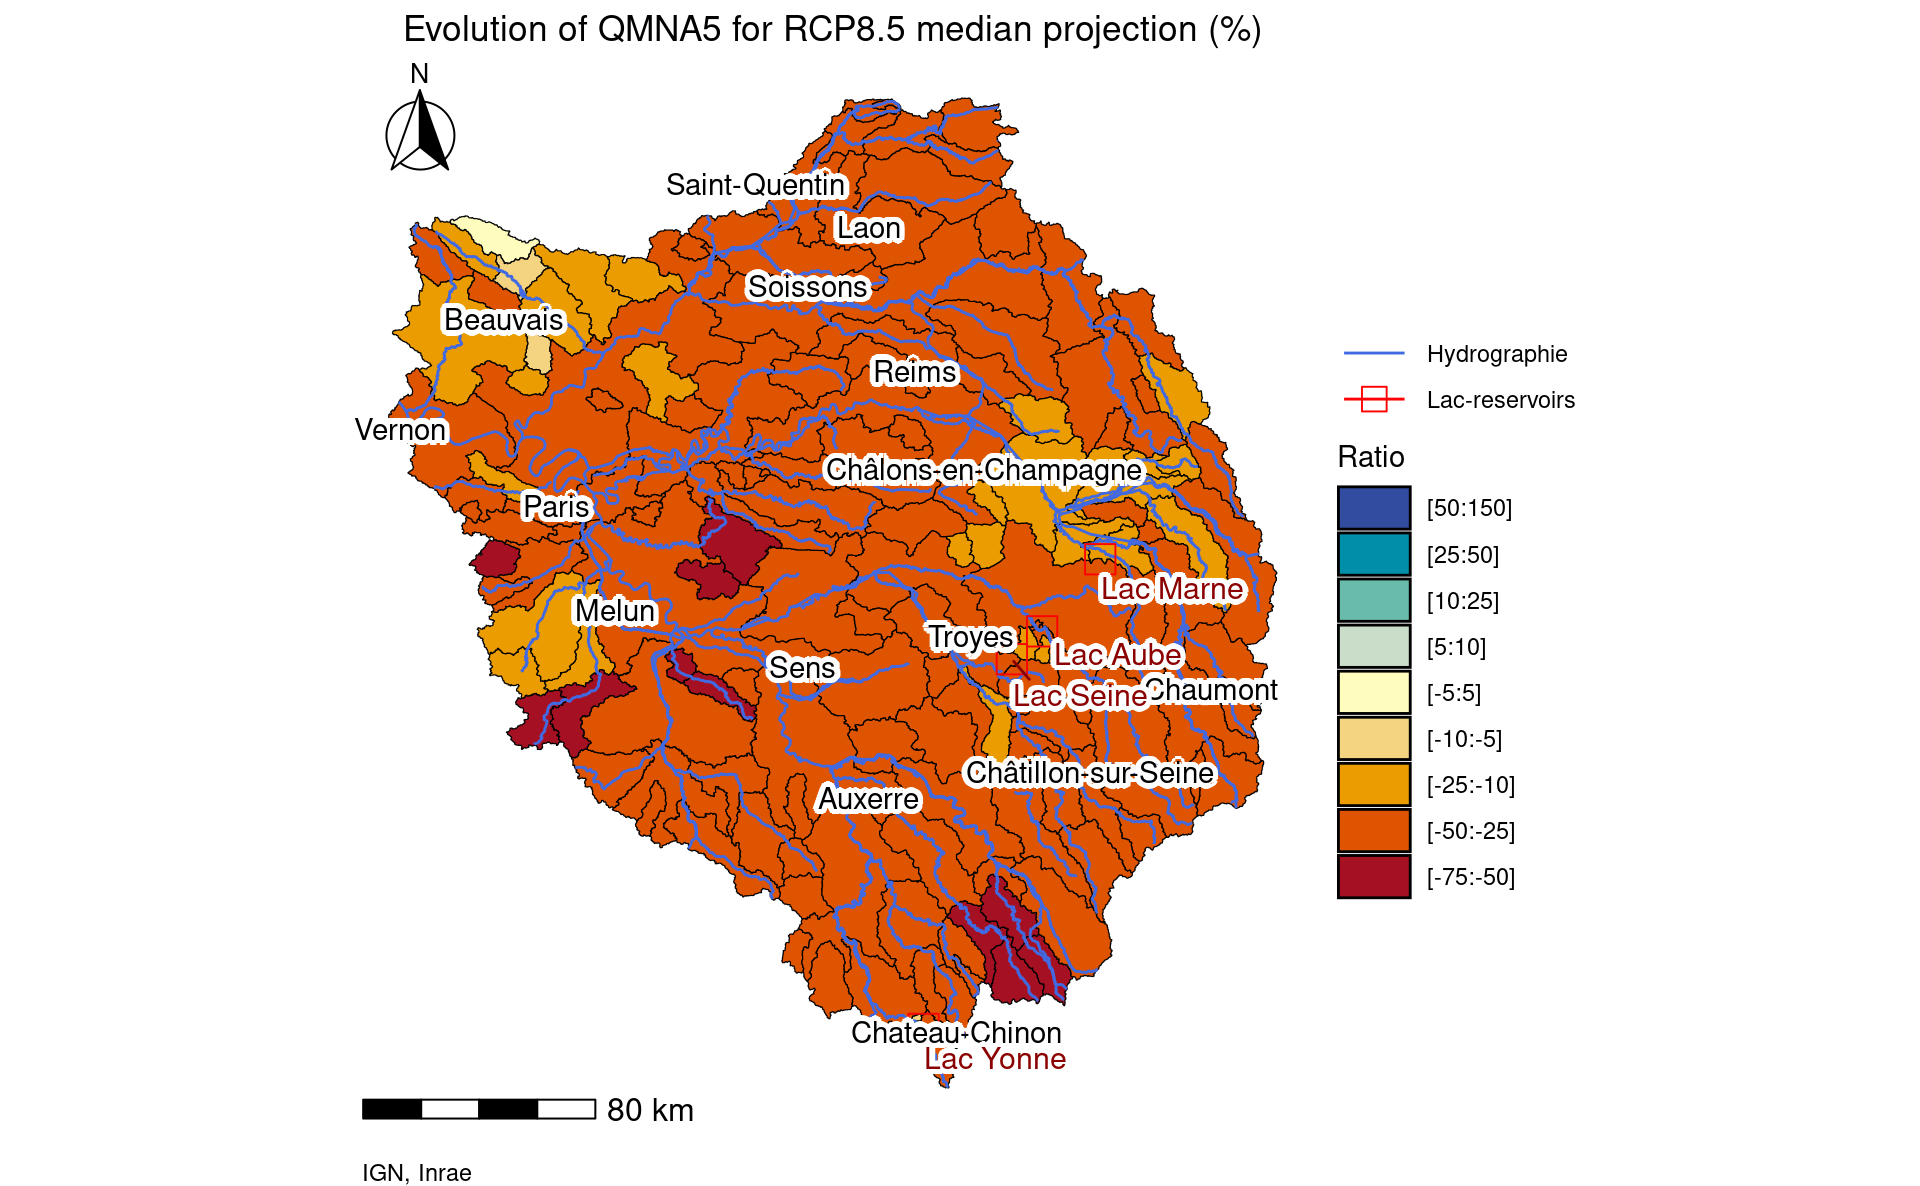
Figure 6.11: Map of median scenario evolution of indicator QMNA5 between 1976-2005 and 2071-2100 for RCP 8.5 with simulated influenced flows
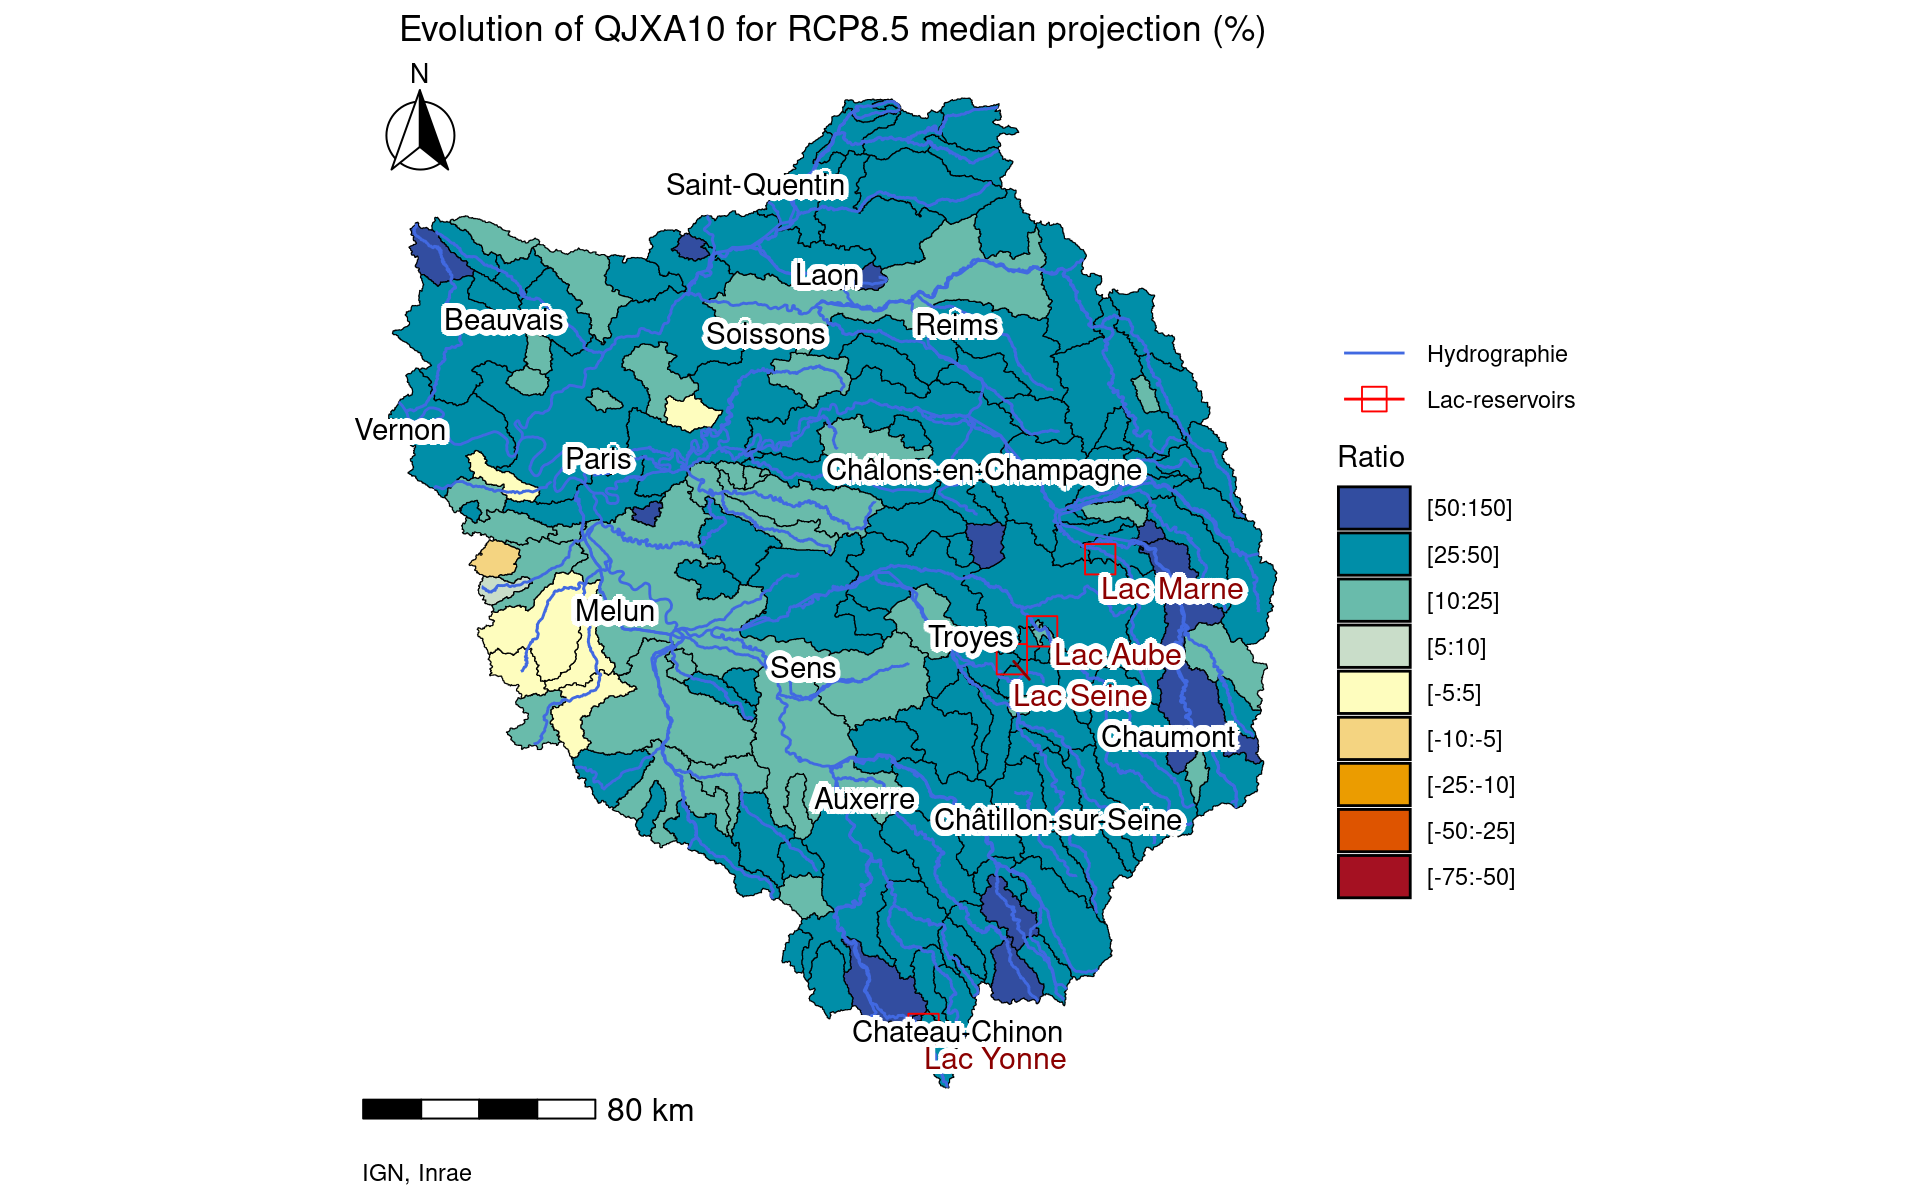
Figure 6.12: Map of median scenario evolution of indicator QJXA10 between 1976-2005 and 2071-2100 for RCP 8.5 with simulated influenced flows
All simulated flows, indicators and maps are available via the link: https://nextcloud.inrae.fr/s/adinzGa3AmLEXnZ?path=%2F04-current_rules%2Fv2.0%2FDRIAS2020_NEW