Chapter 5 Climate change impact on the flow without the reservoir influence
In the Section 3, we carried out a calibration of a hydrological model over the historical period, explicitly taking into account the influence of the four major reservoirs in the basin.
In order to perform the risk assessment of the reservoir management, we need to simulate hydrological flows without the reservoir influences.
5.1 De-influencing by simulation
Of the various methods available for de-influencing flows (Terrier et al. 2020), we have opted for the simulation method. This approach involves simulating the catchment using calibrated model parameters that take into account human influences (see Section @ref{ch-calibration}), while eliminating human influences from the model.
As the reservoir influences are the only human influences explicitly integrated in the model, the naturalization is not complete and does not take into account all other usages (withdrawals for drinking water, irrigation, industries…).
The uninfluenced flow regime downstream the reservoirs is highly perturbated as illustrated in Figure 5.1 for the Aube River at Arcis-sur-Aube. De-influenced flows are higher than observed influenced flows during winter and spring when the reservoir is filling and lower during summer and automn when the reservoir releases for supporting low-flows.
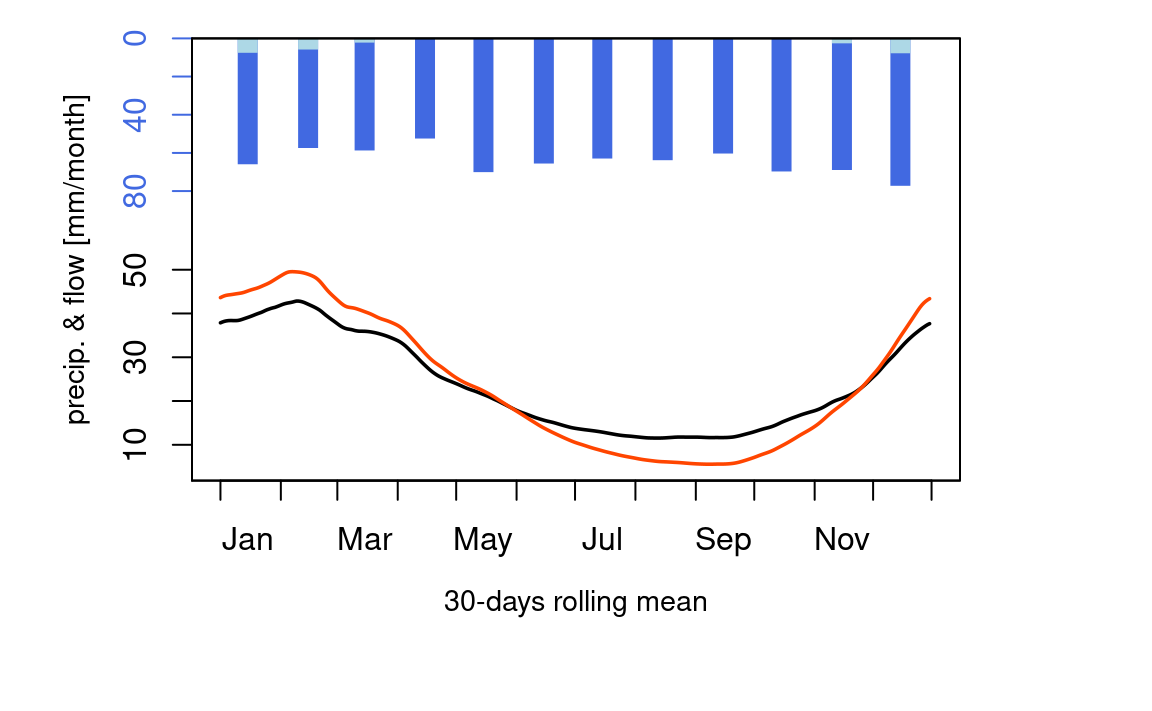
Figure 5.1: De-influenced and observed flow regimes for station H1501010 - the Aube at Arcis-sur-Aube
Simulation output and hydrological indicators for uninfluenced simulated flows computed for the period 1959-2022 can be downloaded from the following address: https://nextcloud.inrae.fr/s/jH5FFGbLXSsBGoA.
5.2 Comparison of uninfluenced simulated flow with other databases
In this approach, we compare the uninfluenced data simulated by our model with the data from the Sogreah/Hydratec database (Hydratec 2011) which, is the uninfluenced flow database formerly used by the ETPB for their studies, including the model developed for the ClimAware project (Dorchies et al. 2014, 2016; Ficchì et al. 2015). This database contains 25 gauging stations that are in common with the 152 stations contained in the seinebasin2 model.
For this comparison, the EPTB wanted to focus on the VCN10 annual indicator which, corresponds to the minimum mean flow calculated over 10 consecutive days. This indicator is used to evaluate the maximum flow released by the reservoirs during the worst low-flow period in the year.
The Figure 5.2 shows that the annual VCN10 indicators for the two data sets at La Seine à Paris are quite similar. Although for some stations we observe values ranging from simple to double, the values remain in the same range, between 25 m3/s and 150 m3/s.
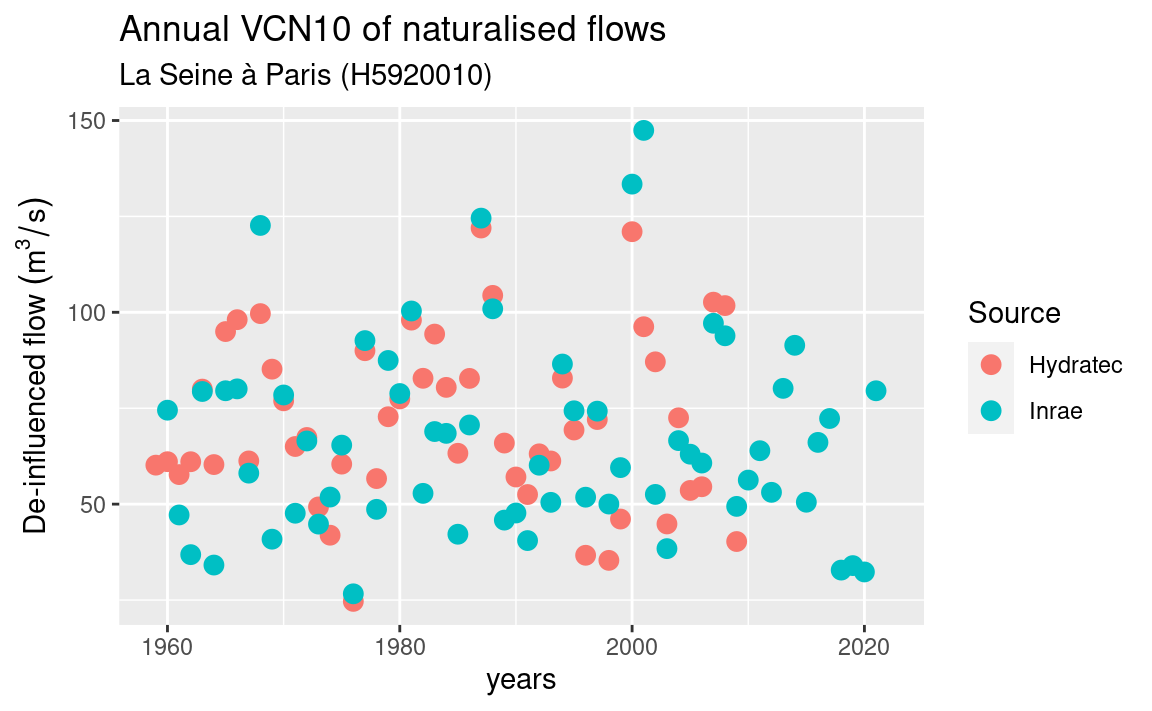
Figure 5.2: Annual VCN10 of Hydratec and seinebasin2 uninfluenced flows at Paris for the historical period
The plot for the 24 other gauging stations can be downloaded at: https://nextcloud.inrae.fr/s/iJJeHpBr56mDHBd
5.3 Simulation of uninfluenced flows forced by climate projections
The model calibrated on influenced flows over the period 1958-2020 is now forced by 11 climate projections for both RCP 4.5 and 8.5 in a configuration without reservoirs.
The simulation outputs of these resulting uninfluenced simulated flows are available at the URL: https://nextcloud.inrae.fr/s/adinzGa3AmLEXnZ?path=%2F03-naturalised_flows%2Fv2.0%2FDRIAS2020_NEW
As a first result we can reproduce the Figure 5.2 which compares the uninfluenced flow of the seinebasin2 uninfluenced flow (noted as Inrae) with the Hydratec/Sogreah database on the annual VCN10 indicator for the gauged station located at Paris. But this time, we prolong the period over 2100 with climate projections.
The Figure @ref(fig:04-plotIndicatorsVCN10RCP4.5) shows the results for the climate projections forced by RCP 4.5, and the Figure @ref(fig:04-plotIndicatorsVCN10RCP8.5) for RCP 8.5.
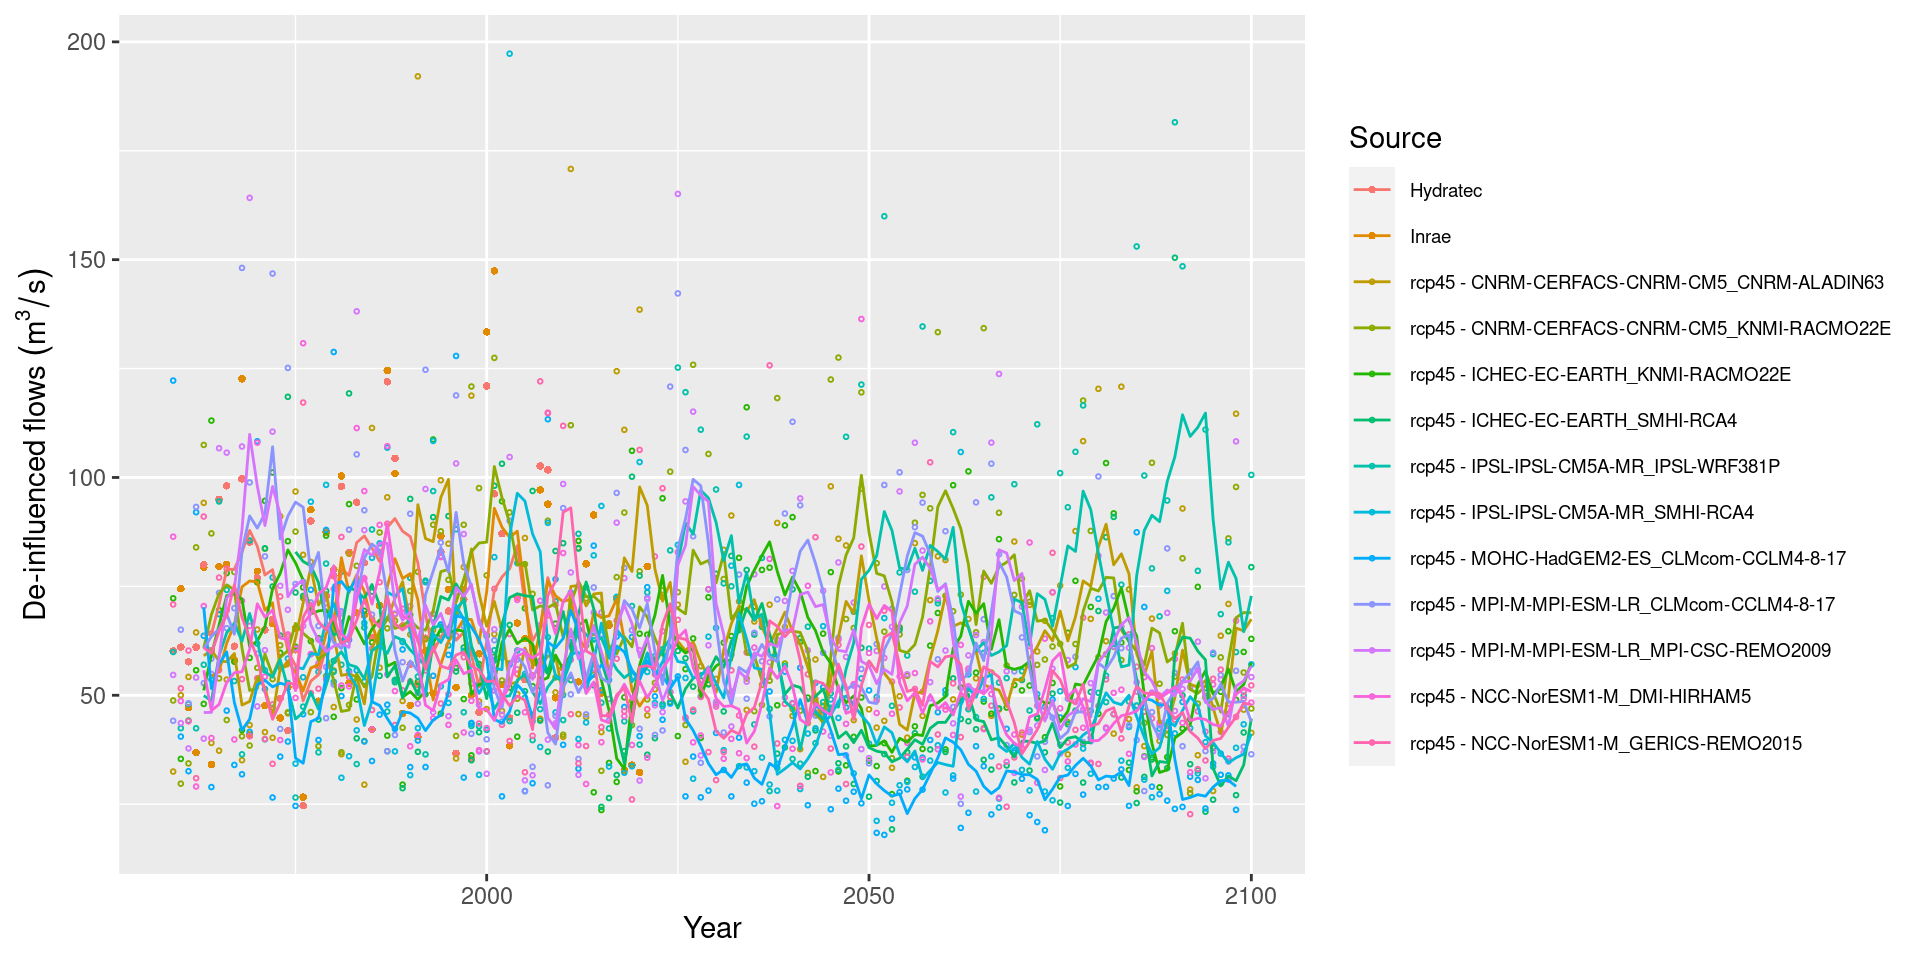
Figure 5.3: Annual VCN10 and 5-years moving average of uninfluenced flows over historical period and future period forced by RCP 4.5 on the Seine River at Paris
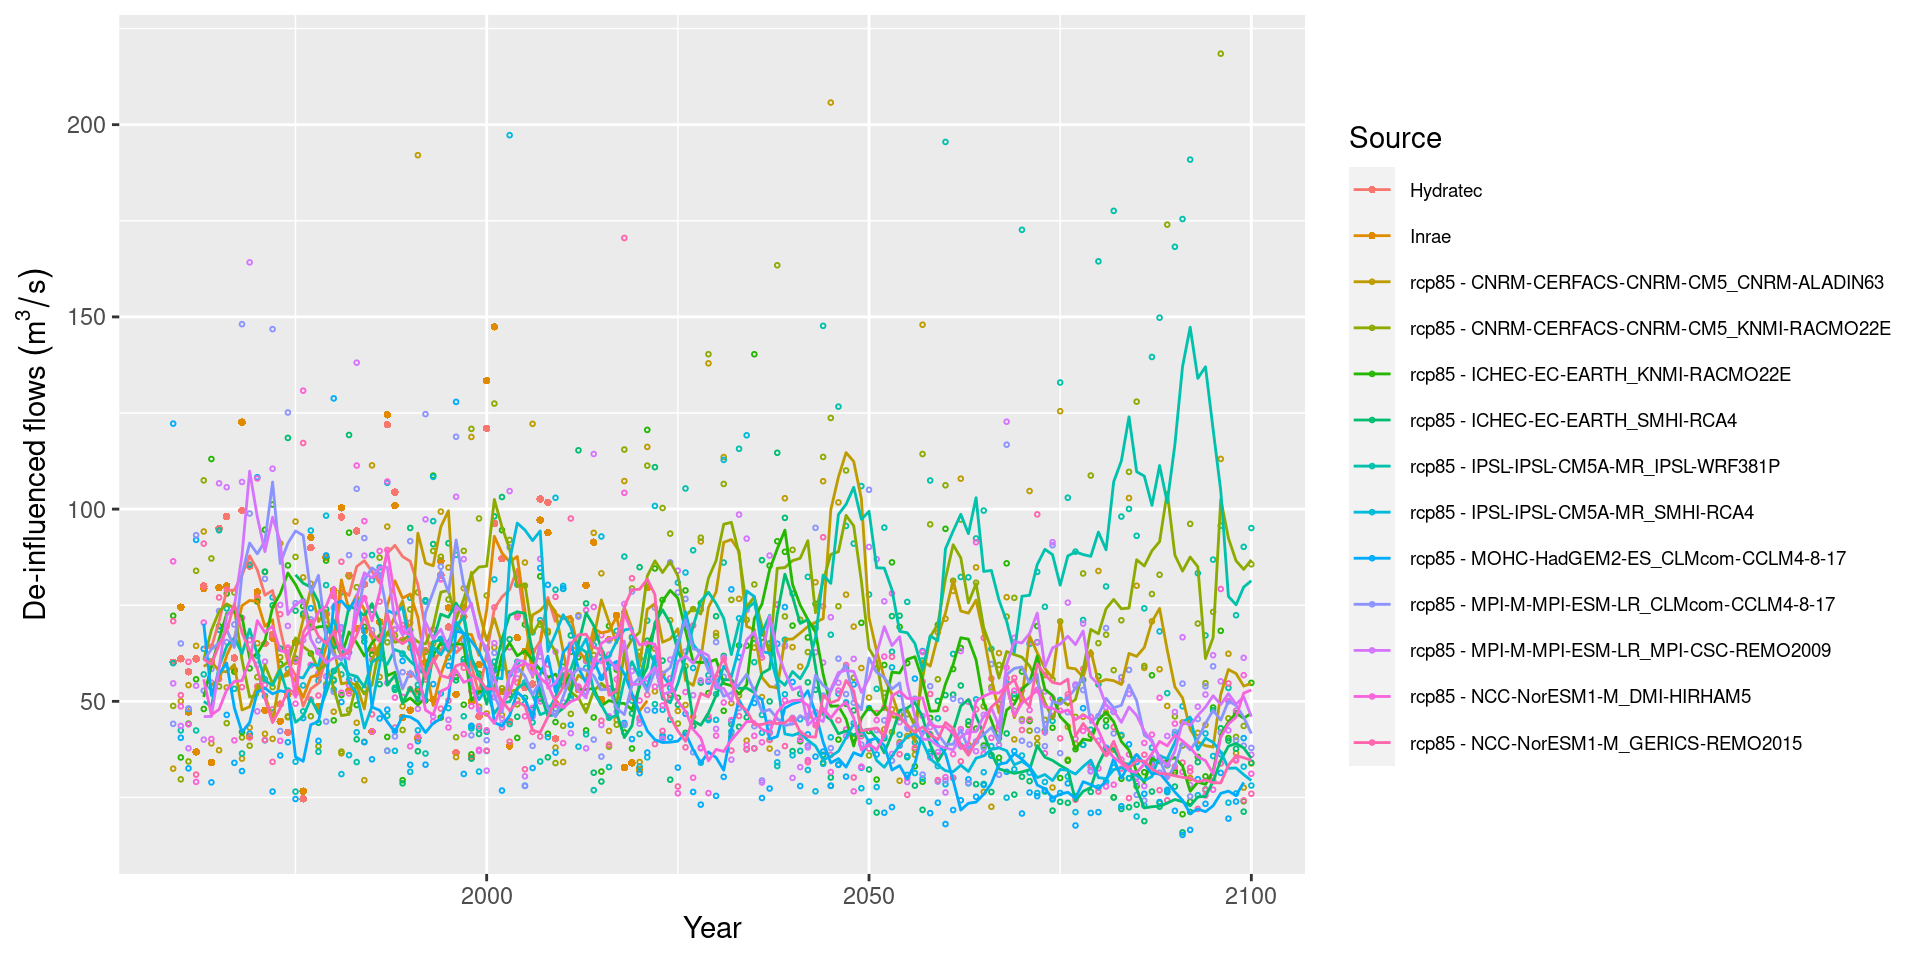
Figure 5.4: Annual VCN10 and 5-years moving average of uninfluenced flows over historical period and future period forced by RCP 8.5 on the Seine River at Paris
The plots for all the gauging stations in the Hydratec data set are available at: https://nextcloud.inrae.fr/s/adinzGa3AmLEXnZ?path=%2F03-naturalised_flows%2Fv1.0
5.4 Impact of climate change on hydrological indicators for flows without reservoir influence
Whereas, the Explore2 project outputs (Strohmenger, Sauquet, and Thirel, n.d.) will provide an up to date overview of climate change impact on water resource in France, the present study on the Seine River cannot be compared to the work done in Explore 2. Indeed, even if this study uses some identical GCM/RCM projections, the Explore2 project will produce more robust projections based on multiple bias correction methods, multiple hydrological models, and will identify the uncertainties in the model chain using uncertainty components partitioning (Evin et al. 2019).
The evolution of hydrological indicators is the ratio between the indicator calculated for the future period (near:2021-2050, medium-term: 2041-2070, distant: 2071-2100) over the one calculated on the reference period (1976-2005).
Evolution indicators are computed separately for each climate projection forced by RCP 4.5 and 8.5 and we show the minimum, median and maximum evolution encountered over the 11 climate projections.
5.4.1 List of indicators
5.4.1.1 Monthly indicators
Monthly indicators for climate data are:
- monthly mean of cumulated precipitation (mm)
- monthly mean of daily mean temperature (°C)
- monthly mean of cumulated potential evaporation (mm)
Monthly indicators for uninfluenced simulated flows are:
- monthly mean of daily mean flow rate (m3/s)
- low-flow monthly mean for a 5 year return period (m3/s)
5.4.1.2 Synthetic indicators
We use the same indicators defined in Section 3.4
For low-flows the indicators are : “VCN10”, “VCN30”, and “QMNA” for a return period of 2, 5, and 10 years computed on a statistical adjustment on a Galton distribution. For high flows: “QJXA” for a return period of 2, 10, and 20 years computed on a statistical adjustment on a Gumbel distribution. For both low-flows and high-flows: quantiles 95% et 10% of daily mean flows.
The calculation method for all these indicators are detailed in Chazot et al. (2012).
5.4.2 Results on monthly flows without reservoir influence
The mean monthly flow at Paris (H5920010) for the reference period (1976-2005) and
for the distant future period (2071-2100) are respectively shown in
Figures 5.5
and 5.6.
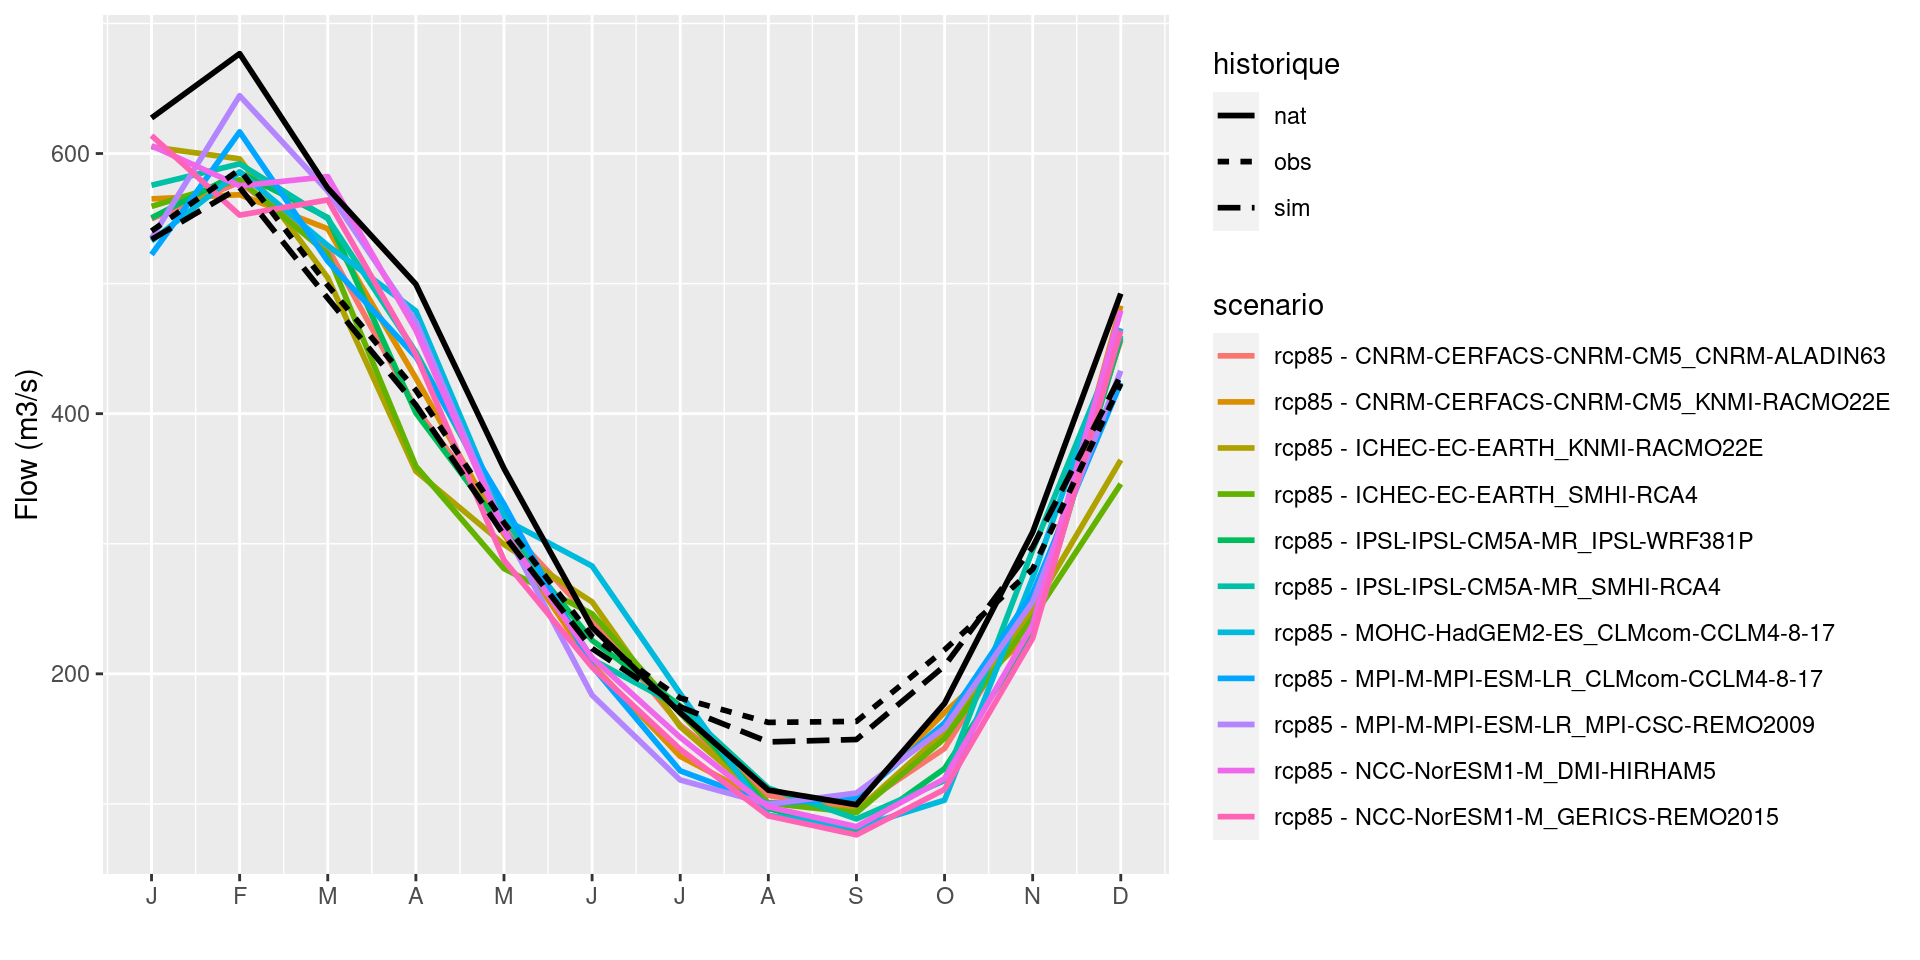
Figure 5.5: Monthly mean flows at Paris (H5920010) calculated on period 1976-2005: comparison between observed (obs), simulated with influences (sim), simulated without influences (nat), and simulated without influence forced by climate projections
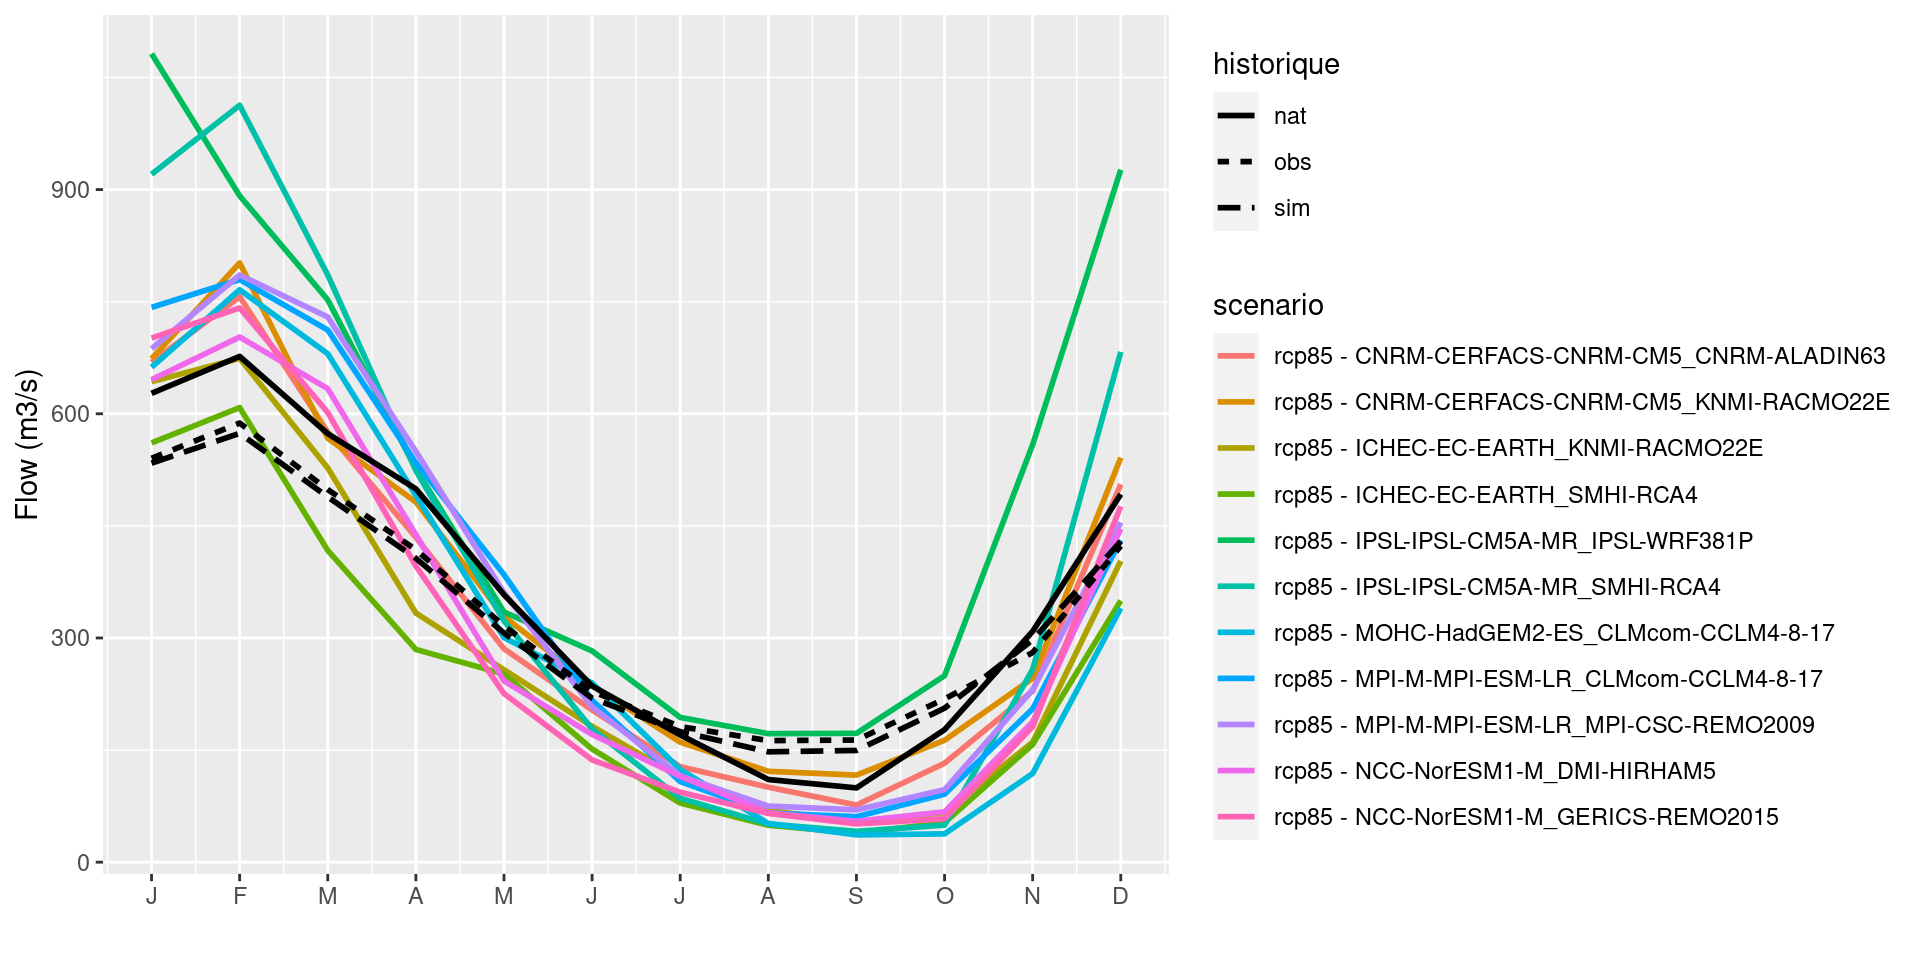
Figure 5.6: Monthly mean flows at Paris (H5920010): comparison between observed (obs), simulated with influences (sim), simulated without influences (nat) calculated on period 1976-2005, and simulated without influence forced by RCP8.5 climate projections calculated on period 2071-2100
5.4.3 Evolution of hydrological indicators
We propose synthetic tables providing minimum, median, and maximum evolution among
the 11 climate projections for each stations for both monthly indicators such as in the
Table 5.1, and hydrological indicators such as in Table
5.2 for Paris-Austerlitz gauging station (H5920010)
between 1976-2005 and 2071-2100 in RCP 8.5.
| obs | sim | nat | min | med | max | |
|---|---|---|---|---|---|---|
| M1 | 540.4 | 533.9 | 627.4 | 0.3 | 21.6 | 96.5 |
| M2 | 587.6 | 573.9 | 676.8 | 4.9 | 30.7 | 71.0 |
| M3 | 498.6 | 488.7 | 573.3 | -20.2 | 9.1 | 42.9 |
| M4 | 418.1 | 406.6 | 499.5 | -20.9 | 7.5 | 31.4 |
| M5 | 316.1 | 306.6 | 357.9 | -21.6 | -5.8 | 16.4 |
| M6 | 228.7 | 219.4 | 235.7 | -38.5 | -15.6 | 25.2 |
| M7 | 181.4 | 174.6 | 170.2 | -53.4 | -24.0 | 17.6 |
| M8 | 162.6 | 147.7 | 110.6 | -54.5 | -31.5 | 78.2 |
| M9 | 163.4 | 149.5 | 99.4 | -58.4 | -35.4 | 118.0 |
| M10 | 218.5 | 206.1 | 177.3 | -64.8 | -43.9 | 96.2 |
| M11 | 280.5 | 297.5 | 308.9 | -56.7 | -20.2 | 141.7 |
| M12 | 423.1 | 429.4 | 492.3 | -27.0 | 5.0 | 102.2 |
| obs | sim | nat | min | med | max | |
|---|---|---|---|---|---|---|
| QA | 335.4 | 329.2 | 359.3 | -18.0 | 6.7 | 62.1 |
| VCN10_2 | 114.7 | 98.4 | 65.1 | -52.5 | -33.2 | 65.0 |
| VCN30_2 | 126.6 | 107.8 | 72.5 | -54.1 | -33.8 | 72.5 |
| QMNA2 | 133.9 | 113.5 | 78.9 | -53.9 | -33.4 | 71.6 |
| VCN10_5 | 91.3 | 73.0 | 46.8 | -51.5 | -28.9 | 46.7 |
| VCN30_5 | 99.5 | 79.6 | 51.5 | -53.0 | -29.9 | 51.5 |
| QMNA5 | 104.9 | 84.0 | 54.7 | -51.6 | -30.2 | 52.8 |
| VCN10_10 | 81.0 | 62.4 | 39.4 | -50.9 | -26.6 | 37.9 |
| VCN30_10 | 87.7 | 67.9 | 43.0 | -52.4 | -27.7 | 41.6 |
| QMNA10 | 92.4 | 71.7 | 45.2 | -50.3 | -28.5 | 43.9 |
| QJXA2 | 1076.2 | 1126.0 | 1373.0 | 1.4 | 21.7 | 69.7 |
| QJXA10 | 1527.7 | 1669.8 | 1928.8 | 10.1 | 30.3 | 73.3 |
| QJXA20 | 1700.3 | 1877.6 | 2141.2 | 7.9 | 31.3 | 77.1 |
In this configuration (RCP 8.5 and evolution between 1976-2005 and 2071-2100), the Figure 5.7 shows the median value of the evolution of the QA indicator which is likely to remain stable downstream Paris with a contrasted light increase for the major part of the basin except for the Beauce natural region where it decreases. The median evolution of the QMNA5 low-flow indicator shows a decrease between 10 and 50% on the major part of the basin (Figure 5.8). And the QJXA10 high-flow indicator shows an increase between 25 and 50% on a majority of gauging stations (Figure 5.9).
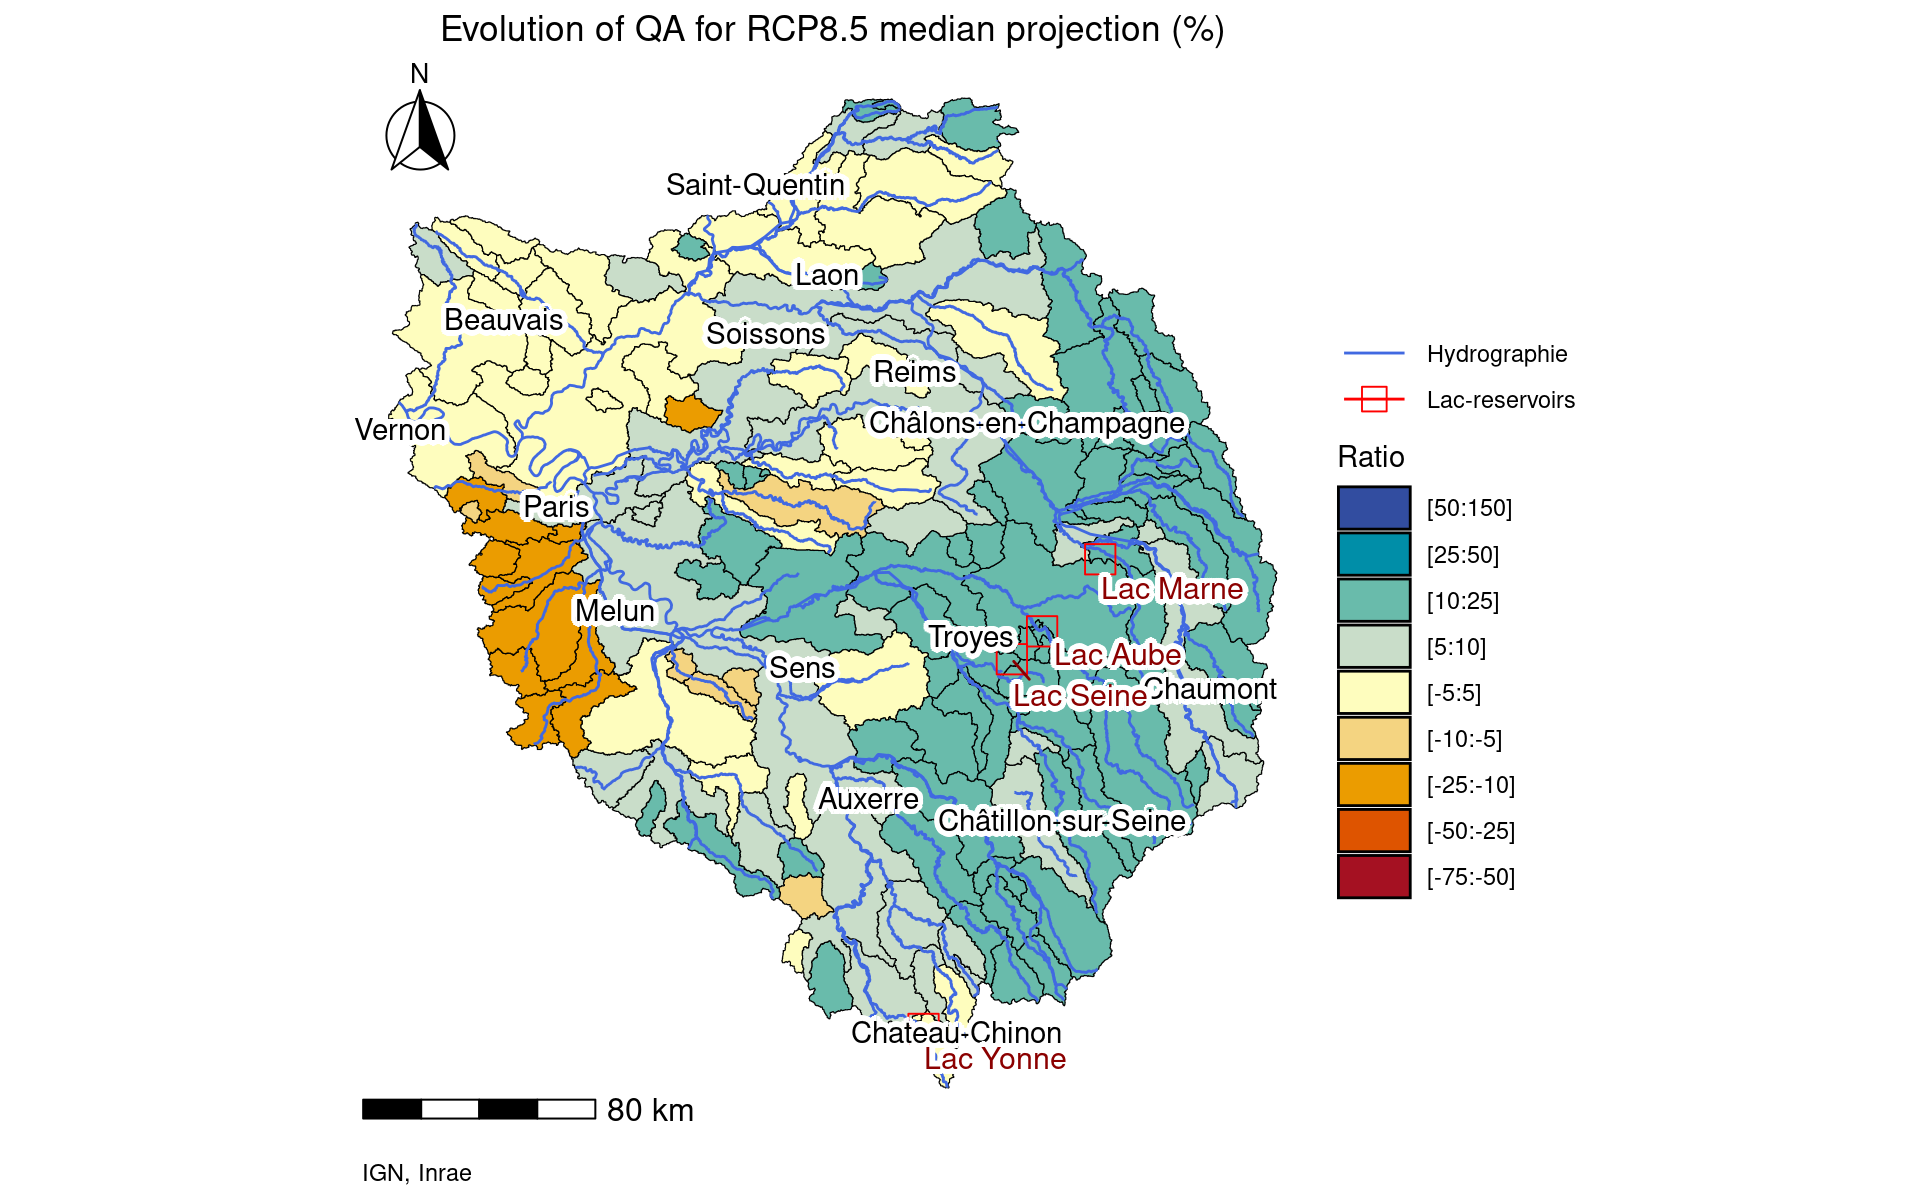
Figure 5.7: Map of median scenario evolution of indicator QA between 1976-2005 and 2071-2100 for RCP 8.5
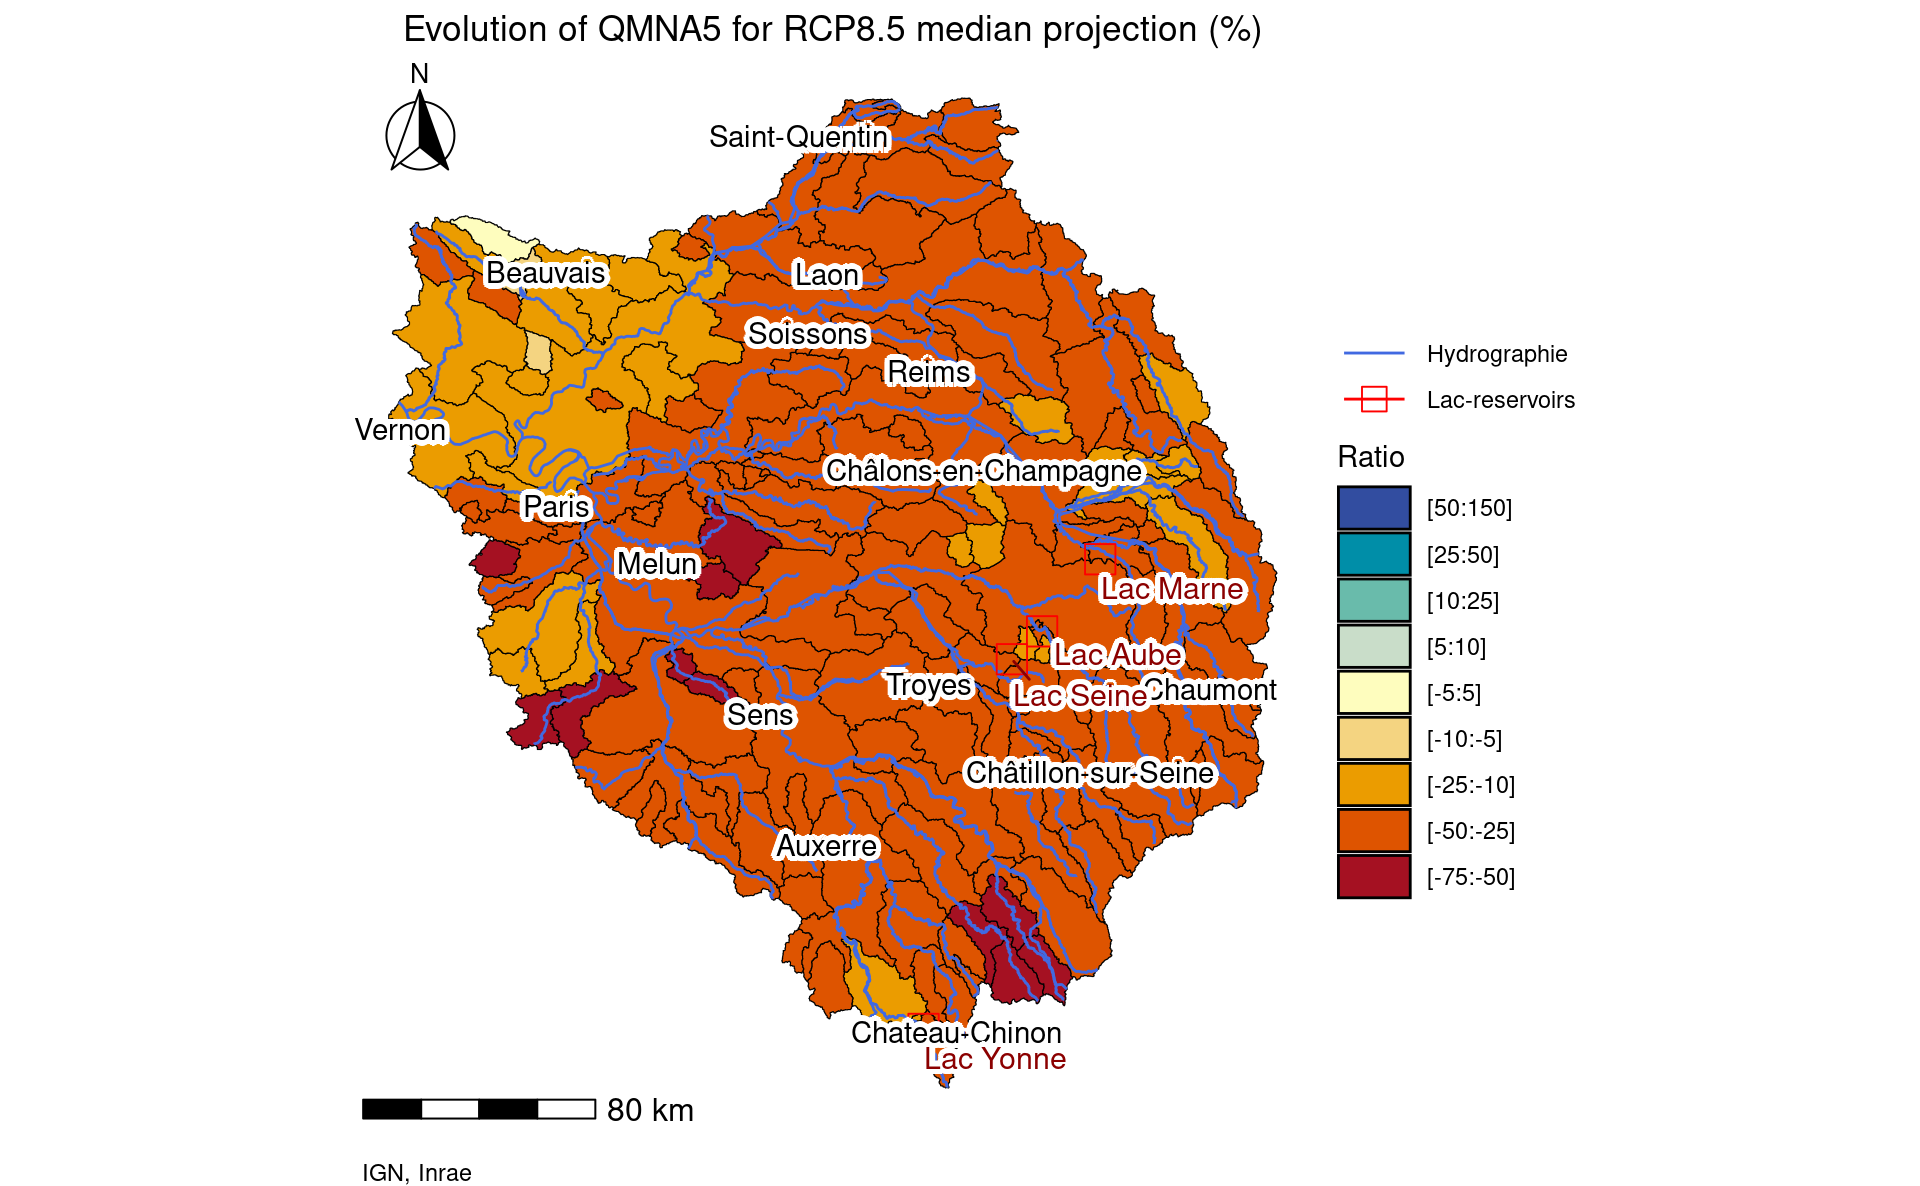
Figure 5.8: Map of median scenario evolution of indicator QMNA5 between 1976-2005 and 2071-2100 for RCP 8.5
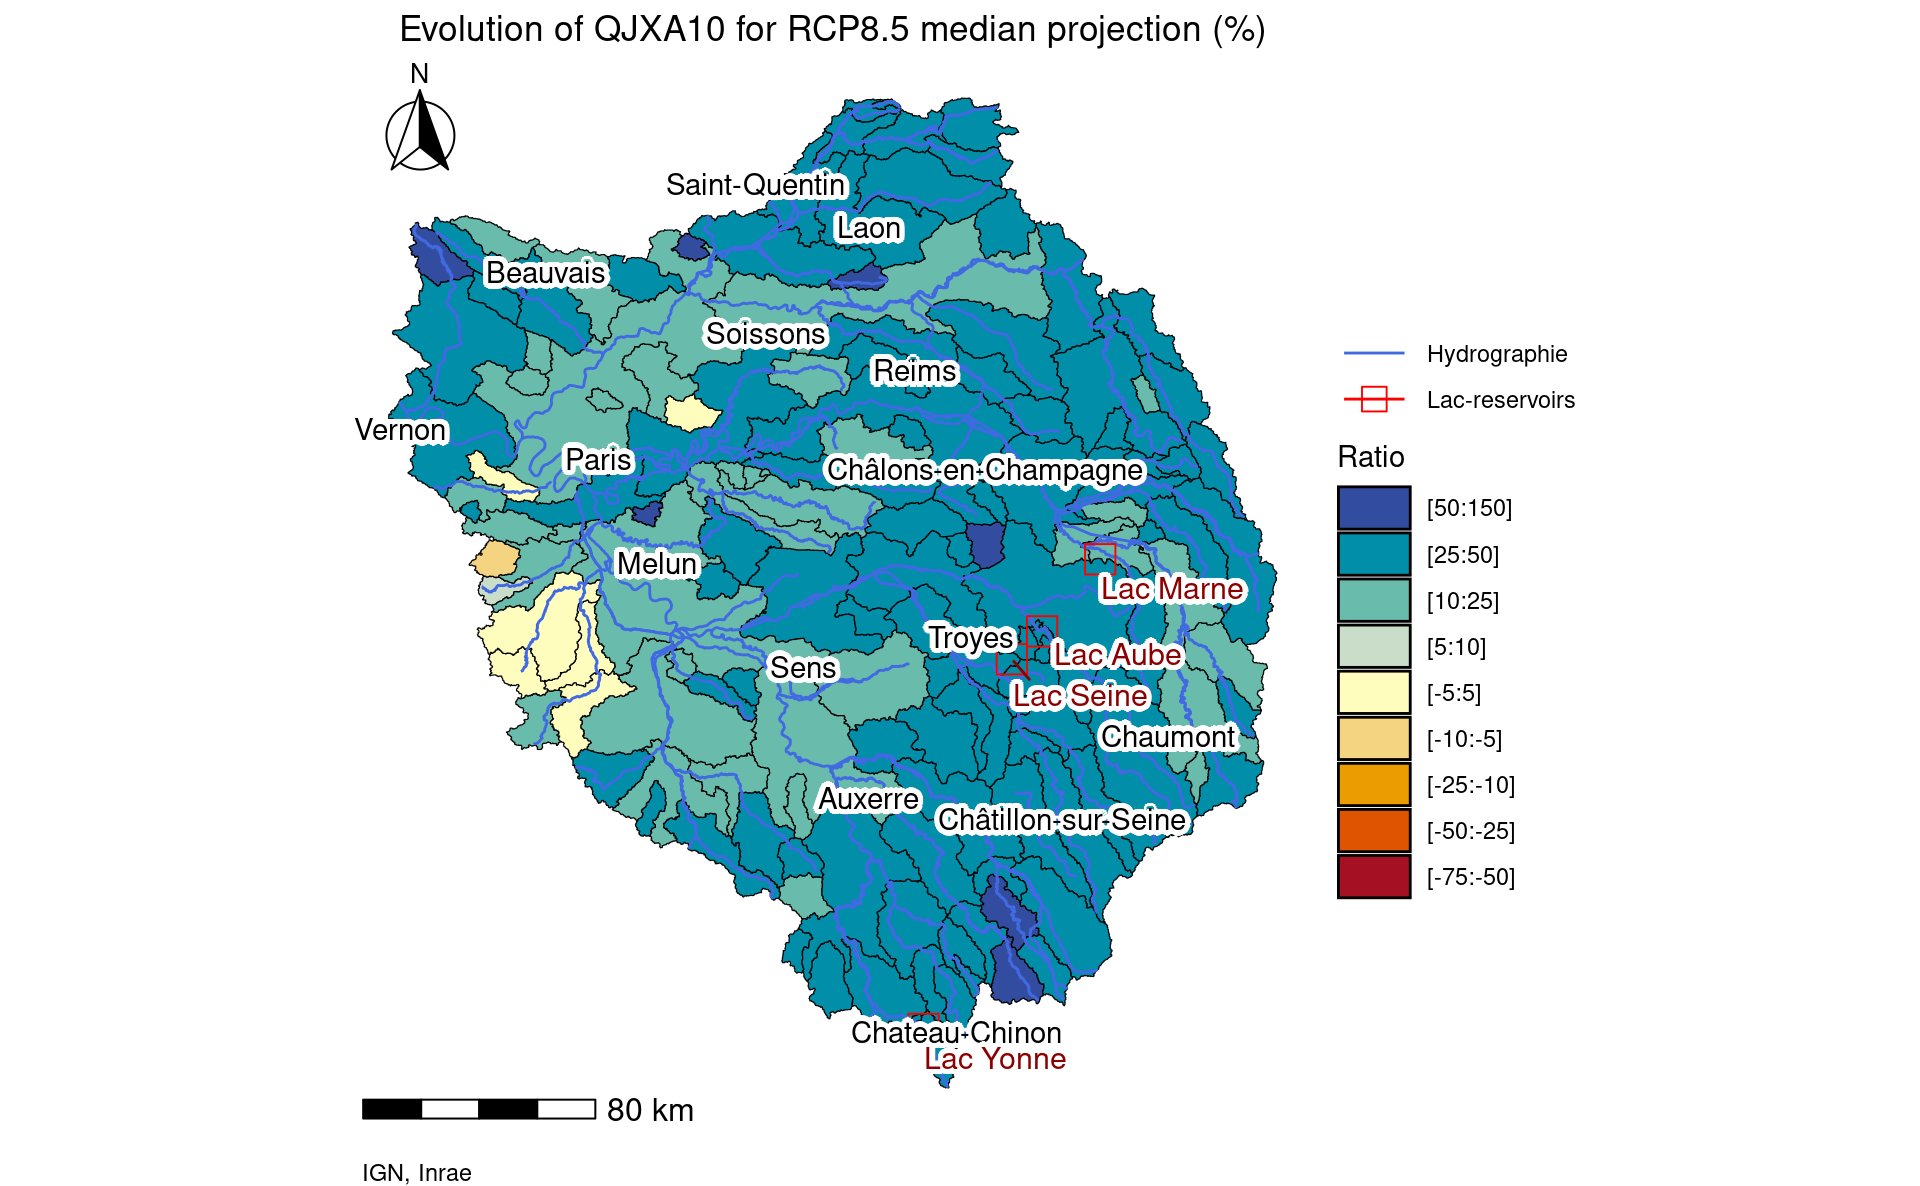
Figure 5.9: Map of median scenario evolution of indicator QJXA10 between 1976-2005 and 2071-2100 for RCP 8.5